Feb 222018
 
Photographs of Joanne Lynn and Sarah Slocum
Authors Joanne & Sarah

By Joanne Lynn and Sarah Slocum

“All models are wrong, but some are useful”. – George Box

In late November, the Centers for Medicare and Medicaid Services (CMS) released an extensive evaluation of the Community-based Care Transitions Program (CCTP). (https://downloads.cms.gov/files/cmmi/cctp-final-eval-rpt.pdf)

While the report has some useful points, the primary metrics used to measure performance – re-hospitalization/discharge rates, are seriously deficient. To start with, reducing hospital readmissions – or, for that matter, reducing admissions – is not always good for patients. More importantly, the CCTP evaluation presumed that the relevant part of the patient’s journey starts in the hospital at discharge, and that the main issues revolve around having and adhering to the correct discharge instructions, especially for medications, which then lead to engaging the patient in his or her outpatient medical care. These are certainly important, but the evaluation’s narrow focus on short-term transitions of care leaves out much of what happens in the lives of seriously ill persons that reflect the capacity of their community to provide ongoing supportive services – disability-adapted housing, home-delivered nutritional food, the adequacy of the personal care workforce, employer flexibility for family caregiving, and more.

The CCTP was part of a larger innovation effort sponsored by CMS, the Partnership for Patients, which had an overall goal of a 20% reduction in Medicare fee-for-service (FFS) hospital readmission rates. The agency was given $500 million to implement CCTP in 101 sites around the country. Most project sites applied basic commonsense transitions of care protocols, for which there is substantial evidence, i.e., ensuring that newly discharged patients received the right medications and were engaged with their community-based physicians in order to prevent avoidable hospital readmissions within 30 days after discharge. Yet the focus on medical services provided at and for a short while following hospital discharge, as well as the metric that applied to hospital rates, distorted the endeavor and put a good number of participating community-based organizations at serious financial risk.

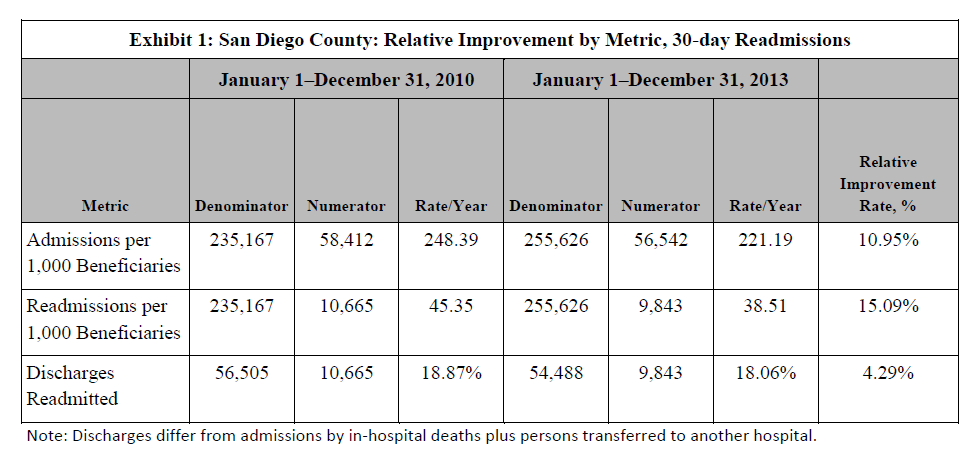
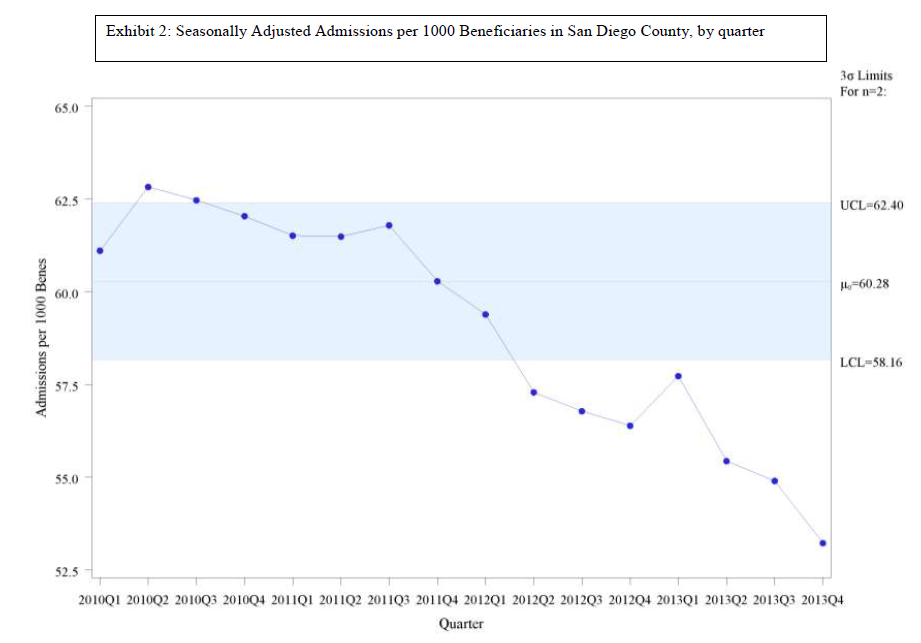
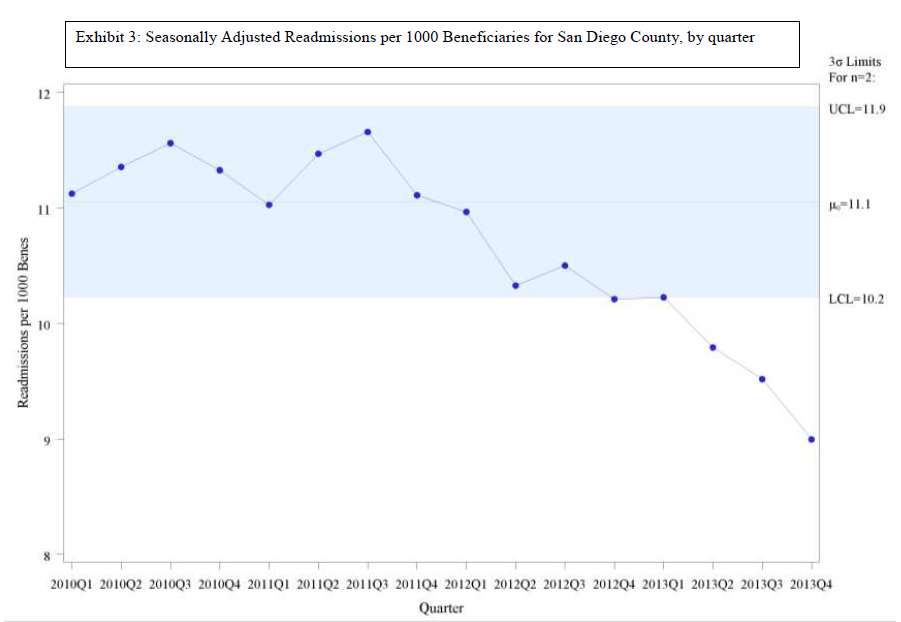
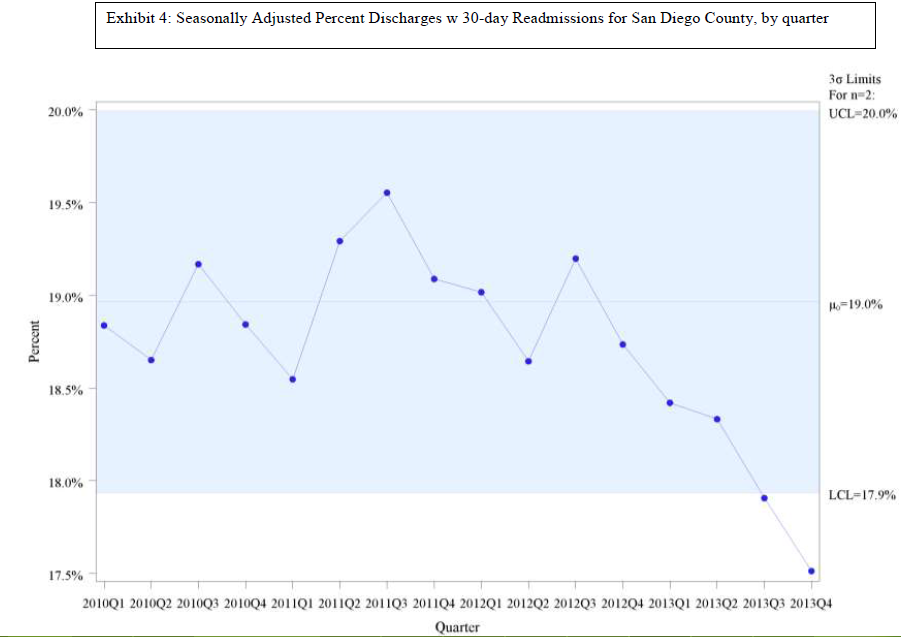
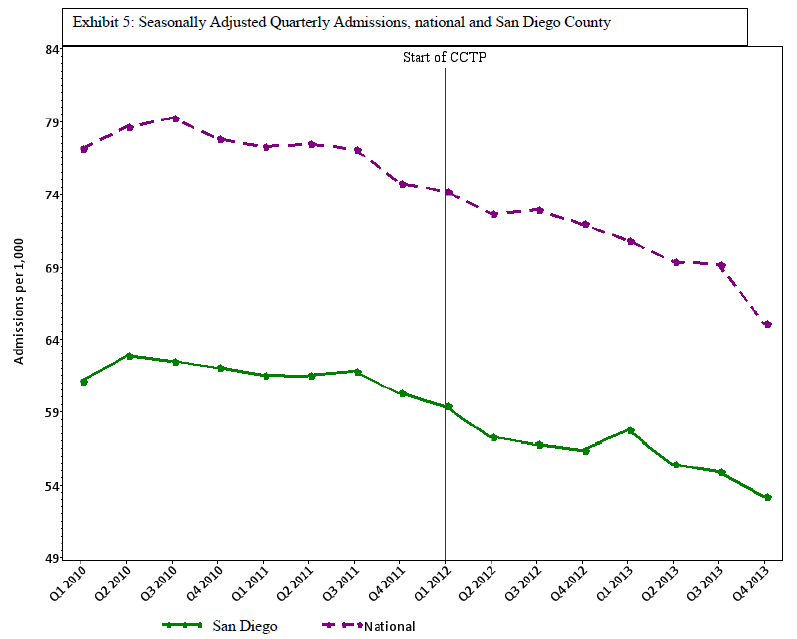
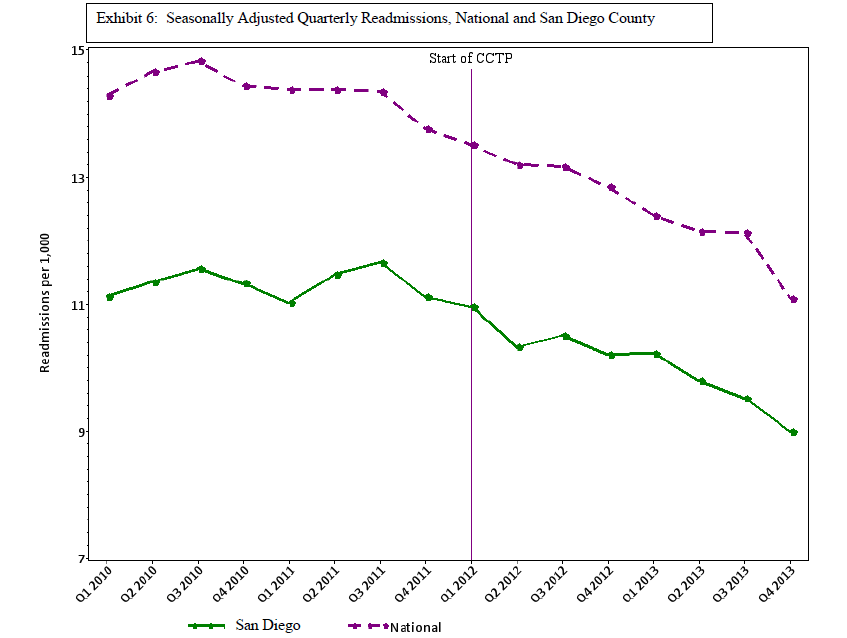
The original Quality Improvement Organization (QIO) project that preceded the CCTP measured the effect of improvement activities on entire communities (rather than specific hospitals), and aimed to reduce readmissions per 1,000 Medicare FFS beneficiaries across the entire population, https://jamanetwork.com/journals/jama/fullarticle/1558278. That model accepted the need not only to address medical errors and mobilize patient self-care, but also to focus on what it takes to successfully shift the support of very sick and disabled persons to community service providers and reduce the challenges of living with ongoing serious illness.

In the QIO project, most Medicare beneficiaries who were re-hospitalized within 30 days were known to be very sick and disabled prior to the initial hospitalization. This meant that the hospitalization episode represented a few somewhat worse days in the course of living with a serious condition, such as an organ system failure, neuromuscular degenerative disease, or frailty. That understanding broadened the focus of reforms to include examining the capacity of the person’s community to support very sick and disabled persons with reliability and competence. The interventions aimed to optimize the overall course of disease and disability and to ensure that the individual and family (and other caregivers) felt well supported. For example, they worked to ensure the adequacy of the care plan, prompt availability of supportive and personal care services, and realistic planning for decline and death.

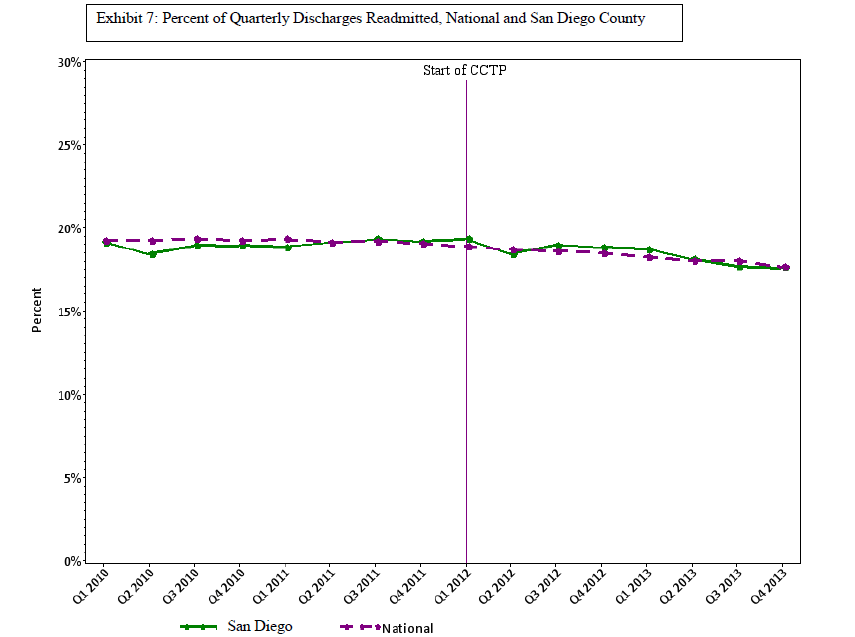
However, in building on the QIO results, CMS shifted the focus to a hospital-centric design and evaluated performance on a hospital-specific basis. This creates the problem that we reported in a previous blog, https://medicaring.org/2014/12/08/lynn-evidence/, which is that good practices in the community reduce the number of admissions at about the same rate as the number of readmissions, is ignored. In turn, this makes the hospital-based readmissions/admissions metric misleading. Perhaps more important, structuring the CCTP to measure the impact only on the hospital leaves out the importance of how effective community-based providers were in providing supportive services over time to frail elders living at home and in other community settings.

Some community services providers nevertheless managed to help their partnering hospitals make impressive gains in reducing re-admissions. For example, the Eastern Virginia Care Transitions Program (EVCTP) brought together five Area Agencies on Aging that improved support and smoothed transitions across 20% of the state. Five health systems and 69 skilled nursing facilities joined. Re-hospitalizations for the whole area declined from 18.2% of all FFS Medicare discharges in 2013 to 8.9% in 2015, resulting in a $17 million savings to Medicare and a great deal of avoided suffering by patients, families, and caregivers. EVCTP used the Coleman Care Transitions Intervention© and offered enhanced services as part of the admissions process for certain segments of the Medicare population. It also prompted formation of a coalition of all 25 Area Agencies on Aging in Virginia to infuse best practices in subsequent partnerships across the state, http://www.chcs.org/media/EVCTP-Case-Study_101217.pdf/.

In Akron, Ohio, “Direction Home,” the Area Agency on Aging’s program, first began embedding coaches (either nurses or social workers) in local hospitals in 1998 to assist patients through connecting them to various community services, including home care and home delivered meals. That history of collaboration between health care providers and social services providers gave Akron a head start in reducing hospital use by Medicare beneficiaries with ongoing serious chronic conditions. Between 2010 and 2016, hospital readmissions fell from 19.6% of Medicare FFS hospital discharges to 11.7%. Akron leaders attribute much of this success to intentional relationship building, which extends to having health system professionals on the boards of community organizations, http://www.commonwealthfund.org/publications/case-studies/2017/aug/akron-ohio-health-care. However, CMS did not allow community-based organizations to use CCTP funds for training, overhead, data development, administration, or outreach – only for the patient-facing services. This meant that some of the community-based organizations encountered major difficulties and high costs in trying to forge initial connections and close working relationships with hospitals in their area.

Other findings in the evaluation point to well-documented challenges for some CCTP sites, including incorrect (or poorly understood) discharge instructions on medications and dietary restrictions; under-resourced community-based services; fragmentation between social services and health care systems; and a lack of data at the individual level for high-value individual care planning, and at the aggregate level for geographically-based system planning.

Every model leaves out a great deal of complexity. What matters is what we retain and take forward in subsequent work. We can accept that high re-hospitalization rates are probably evidence of shortcomings in a hospital’s discharge processes, and that mobilization of patients to take care of themselves gets us partway toward a better model of care. However, we should also include how communities and their social support organizations can improve access to adequate safe housing, nutritious food, reliable personal care, and other key services. That more complex model requires the involvement of multiple stakeholders, and measuring the performance of a complex, multi-faceted care system that serves similarly situated individuals across a geographic community — rather than just the re-hospitalization rates of certain hospitals.

twitterrssyoutube
Dec 162014
 

by Stephen F. Jencks, M.D., M.P.H.

[Also see companion post by Joanne Lynn, M.D.]

Issue.

The Medicare Readmission Reduction Program (MRRP) encourages hospitals to reduce readmissions within 30 days of discharge by imposing substantial financial penalties on hospitals with more readmissions than would be expected if the same patients were discharged from an average hospital.[1] But some hospitals and communities have succeeded too well and reduced discharges even more than readmissions so that their readmission rates, as currently calculated, do not improve much, which puts them at higher risk for penalties. There are two underlying problems:

First, there are two ways of thinking about, and therefore measuring, the rate of readmissions; and they often lead to quite different results and quite different decisions on penalties. One is discharge-based; the other, population-based. The relationship between the two is simple: (readmissions/discharges) X (discharges/(beneficiary population (1,000s) ) ) = readmissions / (beneficiary population (1,000s))

Patients who are admitted but die during hospitalization or are transferred to another hospital are not counted as discharges from the first hospital.

Second, effective interventions to reduce 30-day readmissions have an effect on admissions that extends far beyond 30-days after discharge and they reduce a lot of other admissions, especially if implemented in partnership with community providers and services.

When Congress created the MRRP, many stakeholders had become aware (and dismayed) that 20% of people enrolled in Medicare fee-for-service and discharged from a hospital were readmitted within 30 days of hospital discharge. Clinical trials had shown that improved processes around hospital discharges could prevent many of these readmissions. The aim of establishing accountability also made a hospital focus desirable. In this view, readmission is a burden resulting from poor hospital discharge processes, whether clinically premature or poorly executed. With that emphasis on discharge processes as cause and cure for readmissions, it was natural for the Centers for Medicare & Medicaid Services (CMS) to choose to estimate each hospital’s expected readmissions as the number of patients whom the hospital discharged and who would be expected to be readmitted after discharge from an average hospital. Most readmission reduction initiatives use this discharge-based readmission rate to measure performance. This discharge-based perspective effectively defines the readmission rate as the percentage of discharges that are followed by a readmission. In this way of thinking, the number of hospital discharges is simply a fact of life, much like the fact that a year has 365.24 days. This view does not see that hospital actions might reduce the number of patients they discharge, and this blind spot causes trouble.

Hospitals actually have a great deal of influence on how many patients they admit and discharge because so many of their discharges are admitted through their emergency department or by hospital-affiliated physicians and because they can collaborate with community services and providers who can forestall patients even coming to the hospital. Population-based hospital discharge rates vary substantially across regions, and they can change over time.

Some policy makers worried that the discharge-based rate could behave in unexpected ways if hospitals took steps that reduced total discharges by more than the reduction in 30-day readmissions. As a result, several programs, such as the Partnership for Patients and the Quality Improvement Organizations’ (QIOs) Care Transitions Program, were designed using a population-based readmission rate or converted to such a rate after evaluating early findings. The population-based rate is the number of readmissions for every 1,000 fee-for-service Medicare beneficiaries in the hospital’s service area. This view sees readmissions as a community health problem, a burden on a population of beneficiaries and the Medicare trust funds that is associated with that population’s use of hospitals just as hospital-acquired infections are associated with use of hospitals. From this perspective, preventing hospitalizations, improving discharge transitions, and improving post-discharge care are equally valid ways to reduce readmissions. Whether the hospital reduced hospitalizations in order to reduce readmissions is less important than being sure that we do not penalize hospitals for taking such steps. Population-based rates are closely aligned with the three-part aim of the National Quality Strategy (individual care, population health, and affordability), not only because they are population-based but also because they reflect the close relationship between care in the community and a hospital’s apparent performance.

Thus, a program can reduce burdens on beneficiaries and Medicare through significant reductions in the population-based discharge and readmission rates but see much smaller reductions in the discharge-based readmission rate. In a companion blog to this piece, Joanne Lynn presents evidence that this attenuation of changes in discharge-based rates has happened repeatedly in community-based readmissions programs. We do not know, at this point, whether attenuation of changes translate into financial penalties but it seems very likely to increase a hospital’s risk.

We also do yet fully understand what specific changes produce these decreases in the population-based discharge rate, but the most parsimonious explanation is that the causes are pretty much the causes of reduced readmissions: Provide urgent care with support for keeping the patient in the community, and you are likely to reduce all admissions, not just readmissions. Enroll more patients in medical homes, and the benefits will not disappear 30 days after hospital discharge. Improve nursing home communications with emergency rooms, and the benefits will not be limited to patients within 30 days after hospital discharge.

What we can foresee is that hospitals, already wary of readmissions reduction because it directly reduces revenue, will become doubly wary if they conclude that reducing discharges may also cause or increase the MRRP penalty. If CMS is penalizing hospitals and communities for succeeding at improving care and reducing costs, the reaction may threaten a very successful set of initiatives. The examples we report are for community-based efforts to reduce readmissions. Hospital-level calculations are generally beyond our capability. CMS can, however, easily determine whether, all else being equal, penalties are more likely or larger in areas where the population-based hospital discharge rate is declining substantially than elsewhere. That information is urgently needed.

What to do.

The purpose of the MRRP is to reduce the burden of readmissions on Medicare beneficiaries and the Medicare trust funds, so the important indicator of progress is the number of readmissions, not the percentage of discharged patients that are readmitted.

Healthcare quality measurement needs to catch up with the National Quality Strategy and add measures of the impact of care on the health of the population that will complement measures of the quality of individual episodes of care such as hospitalizations. In the case of readmission measurement for the MRRP, this need is substantially more urgent because there is good reason to fear that a hospital that engages with its community and does exactly what the MRRP hopes for is more liable to financial penalties under the current, discharge-based measure than it would be under a population-based measure.

The first step is to assess the degree of urgency by examining national evidence on actual penalties. If unreasonable penalties are at all frequent then the problem is far more urgent. This will be complex, because Epstein has already shown in cross-sectional studies that population-based hospitalization rates and readmission rates are positively correlated.[2] At the same time it will be important to develop population-based measures of readmissions and compare their impact on penalties with the impact of discharge-based measures. The obstacles are bureaucratic, technical, and political.

Bureaucratically, the most important obstacle has been a widespread belief that the Patient Protection and Affordable Care Act requires calculating discharge-based rates. In fact, the Act says only that penalties are to be determined from the ratio of observed to expected numbers of readmissions and is silent on how the expected number is to be calculated. The other bureaucratic problem is less tractable: Under current procedures, the steps laid out for implementing a new measure, both at CMS and at the National Quality Forum (NQF) would likely take several years. The process should be expedited if the analysis of current penalties indicates that hospitals are being penalized for success in reducing admissions.

The technical challenges of creating a population-based readmission measure for hospitals are substantial. First, the procedure must find a way to measure each hospital’s population-based hospitalization rate. Second, a method of risk adjustment must be developed and applied so that population-based readmission rates for each hospital and community can be compared. Although these methods are still evolving, adjustments for factors such as neighborhood deprivation[3] are actually easier at the population level. These are difficult tasks, but a first step good enough to improve on the existing model should be possible within a year.

Politically, hospitals will be concerned about accountability for the community hospitalization rate. They will recognize that if hospitals in areas with low hospitalization rates are protected, then hospitals in areas with high hospitalization rates will be more vulnerable.

Some have hoped that traditional risk adjustment could solve this problem, because the most likely scenario is that average risk of readmission increases as the number of discharges decreases. That prospect is not promising, because the most assiduous work on risk adjustment has produced tools of only moderate power. The prospects for solving this problem with improved risk adjustment are not promising.[4],[5]

When you find yourself in a hole you should stop digging. It seems prudent for NQF to suspend endorsement of the pending discharge-based readmission measures and for CMS to delay implementing discharge-based measures if NQF endorses them until CMS has studied and reported the extent to which readmission penalties punish hospitals that are actually reducing both admissions and readmissions and has laid out an approach to any problems found. Finally, the problem identified here underlines the importance of placing a population-based foundation under at least some measures of health care system performance.

Footnotes:

[1] Centers for Medicare and Medicaid Services. Readmission reduction program. Retrieved from http://www.cms.gov/Medicare/Medicare-Fee-for-Service-Payment/AcuteInpatientPPS/Readmissions-Reduction-Program.html

[2] Epstein, A. M., Jha, A. K., & Orav, J. E. (2011 December 15). The relationship between hospital admission rates and rehospitalizations. New England Journal of Medicine 365(24).

[3] Kind, A. J. H., Jencks, S., Brock, J., Yu, M., Bartels, C., Ehlenbach, W., & Smith, M. (2014 December 2). Neighborhood socioeconomic disadvantage and 30-day rehospitalization: a retrospective cohort study. Annals of Internal Medicine 161(11) 765-775.

[4] Yale New Haven Health Services Corporation/Center for Outcomes Research & Evaluation. (2014, July). 2014 measure updates and specifications: Hospital-wide all-cause unplanned readmission – version 3.0. Retrieved from https://altarum.org/sites/default/files/uploaded-publication-files/Rdmsn_Msr_Updts_HWR_0714_0.pdf.

[5] Kansagara, D., Englander, H., Salanitro, A., Kagen, D., Theobald, C., Freeman, M., & Kripalani, S. (2011 October 19). Risk prediction models for hospital readmission: A systematic review. Journal of the American Medical Association 306(15) 1688-1698.

twitterrssyoutube
Dec 082014
 
Dr. Joanne Lynn Portrait

By Joanne Lynn M.D.

[Also see companion post by Stephen F. Jencks, M.D., M.P.H.]

Care transitions improvement programs have been effective in helping the health care system both become more effective in serving people living with serious chronic conditions and reduce costs. However, the key metric used to measure performance is seriously malfunctioning in at least some hospitals and communities, leading to penalties and adverse publicity for providers and communities that are actually performing well and continuing to improve performance. In this post we provide supporting data, and a companion blog article provides a thoughtful discussion of the conceptual issues underlying this troubling malfunction. For our earlier blog post about this problem see: https://medicaring.org/2014/08/26/malfunctioning-metrics/.

Very simply, this problem arises because the metric used is some variant of readmissions (within 30 days) divided by discharges (from a particular hospital) within a particular period. Thus, the usual metric is something like “20% of Medicare fee-for-service (FFS) hospitalizations are followed by a readmission within 30 days.” This metric works well if the denominator, namely the number of hospitalizations, is not affected by the improvements that reduce the risk of readmission. If the denominator declines along with the numerator, the metric will not reflect the degree of improvement that was actually achieved. The data below show that this happens in real situations.

We are here showing the data from San Diego County, a very large county with about 250,000 Medicare FFS beneficiaries, who had about 60,000 Medicare FFS admissions to hospitals per year and about 10,000 readmissions per year in 2010, when almost all of the hospitals and the county’s Aging & Independence Services (functioning as the Community-based Care Transitions Program partner agency/Area Agency on Aging/Aging and Disability Resource Center) started working together to improve care transitions and reduce readmissions under the San Diego Care Transitions Program, one of the Community-based Care Transitions Programs initiated by Section 3026 of the Patient Protection and Affordable Care Act. The application year was 2012 and the start-up year was 2013. The table below shows an initial summary of their results, provided through their Quality Improvement Organization.

Exhibit 1: San Diego County: Relative Improvement by Metric, 30-day Readmissions

Exhibit 1: San Diego County: Relative Improvement by Metric, 30-day Readmissions

Readmissions of county Medicare FFS residents fell by 15% in 2013, compared with 2010. San Diego County reduced hospitalizations by 11%. However, when the numerator and denominator go down at nearly the same rate, the fraction moves just 4.3%, which falls far short of the 20% reduction goal that Medicare has set.

What follows are the quarterly data from San Diego. The first graph, Exhibit 2, shows the quarterly rate of admissions per 1,000 Medicare FFS beneficiaries in San Diego County. We have adjusted these data for the effects of seasons on admissions (since there are usually more admissions in the winter). The shaded portion shows the “control limits,” an area which represents the expected range of variation demonstrated in the first 3 years of the data (2010-2012). Data that fall outside of the range or that consistently run on one side of the midline indicate that something has changed in how the system is functioning. Clearly, admissions are falling.

San Diego Seasonally Adjusted Admissions

Exhibit 2: San Diego Seasonally Adjusted Admissions

The second graph, Exhibit 3, shows the readmissions rate in the same framework – quarterly rate of readmissions per 1,000 Medicare FFS beneficiaries in San Diego County, adjusted for seasonality. The control limits again show change. Readmissions are falling.

Exhibit 3: Seasonally Adjusted Readmissions

Exhibit 3: Seasonally Adjusted Readmissions

The third graph, Exhibit 4, shows the metric in the conventional form, readmissions divided by discharges. The graph does eventually show a decline, but only a modest one. The fact that the denominator was falling attenuated the impact of the falling number of readmissions.

Exhibit 4: Seasonally Adjusted Percent Discharges with 30-day Readmissions for San Diego County, by quarter

Exhibit 4: Seasonally Adjusted Percent Discharges with 30-day Readmissions for San Diego County, by quarter

The next three exhibits show the comparison of the San Diego measures with the national rates for the same metrics. Exhibit 5 shows that San Diego County is dramatically less likely to have Medicare FFS beneficiaries in the hospital than the nation as a whole: 56 per 1,000 per quarter in San Diego, compared with 69 per 1,000 per quarter nationwide. Exhibit 6 shows that San Diego is also much lower in readmissions than the national average: 10 per 1,000 per quarter in San Diego, compared with 12 per 1,000 per quarter nationwide. In both cases, the declining use is reasonably parallel between San Diego and the nation. This would imply that improvement strategies are still being effective at this lower range, and thus the lower range is not yet a limit on improvement opportunities. Exhibit 7 shows that San Diego County’s conventional metric of readmissions divided by discharges simply tracks the national average. Clearly, the metric is not functioning in a way that reliably separates good practices from wasteful ones. That readmissions over discharges metric does not convey the fact that San Diego is much less likely to hospitalize and to rehospitalize. Indeed, 10 of the 14 San Diego hospitals eligible for penalties for high readmission rates are being penalized next year. Since the calculations that go into determining the hospital penalty focus on particular diagnoses in three past years, it is possible that these hospitals manage to do badly with those diagnoses in those years, but it seems quite unlikely. More plausibly, the metric used is of the readmission divided by discharge form, so the shrinking denominator will affect this calculation.

Exhibit 5: Seasonally Adjusted Quarterly Admissions, National and San Diego County

Exhibit 5: Seasonally Adjusted Quarterly Admissions, National and San Diego County

Exhibit 6: Seasonally Adjusted Quarterly Readmissions, National and San Diego County

Exhibit 6: Seasonally Adjusted Quarterly Readmissions, National and San Diego County

Exhibit 7: Percentage of Quarterly Discharges Readmitted, National and San Diego County

Exhibit 7: Percentage of Quarterly Discharges Readmitted, National and San Diego County

Without access to and analysis of much more data, one cannot know how widespread this problem is. We do know that San Francisco had an admission rate of just 50 per 1,000 per quarter in 2013 and a readmission rate of just 8 per 1,000 per quarter, which are rates much lower than San Diego. Yet 8 of San Francisco’s 10 eligible hospitals will be penalized for excessive readmissions in 2015. Furthermore, we know that the initial Medicare foray into this work, published in the Journal of the American Medical Association in January 2013 (link: http://jama.jamanetwork.com/article.aspx?articleid=1558278&resultClick=3 “Association Between Quality Improvement for Care Transitions in Communities and Rehospitalizations Among Medicare Beneficiaries”, see “Outcome Measures”), involved 14 smaller communities, and that project had to change from using the discharge-based metric to using the population-based metric when it became clear that the shrinking denominator was making the project monitoring unreliable.

Hospitals, other providers, and communities that believe they may be adversely affected by the malfunctioning metrics should have access to the data needed to investigate and CMS should welcome reconsideration of those situations. NQF should suspend endorsement of new readmission/discharge metrics and re-examing existing ones. CMS has multiple contractors working on readmissions, and some have substantial experience and skills in the technical details of these metrics. CMS should quickly modify their contracts to require them to investigate the extent of this problem, to identify steps to ameliorate adverse impacts of the current readmissions/discharges metrics, and to build the metrics that can guide care transitions work into the future. Certainly, the time has come to sort this out and develop metrics that reliably separate exemplary from persistently inefficient practices.

Want to know more?

“Protecting Hospitals that Improve Population Health” by Stephen F. Jencks.
https://medicaring.org/2014/12/16/protecting-hospitals/

“Senior Alert: A Swedish National Dashboard for Preventitive Care for the Elderly” by Elizabeth Rolf.
https://medicaring.org/2014/12/22/senior-alert/

twitterrssyoutube
Aug 262014
 

By Joanne Lynn and Steve Jencks

Work to reduce readmissions has started to yield remarkable improvements in integration of care for frail elderly people – by prompting hospital personnel to talk with community-based service providers, by teaching patients and families how to manage conditions and navigate the health care system more easily, and by paying more attention to trying to fill gaps in the community’s services. But the measure being used to track improvement is seriously misfiring in some settings, and if CMS does not mitigate the adverse impacts, they may become destructive to the momentum and the good that has been done. This is much more than an issue of imperfect risk adjustment or inadequate identification of planned readmissions: it is a punitive error that undermines program goals.

Since CMS mostly aims to assign responsibility for readmissions to the discharging hospital, the key metric has been the risk of readmission for the average person discharged, which is the number of readmissions, divided by the number of live discharges. Any time outcomes are monitored with a ratio, one has to watch out for whether interventions that affect the numerator also affect the denominator. Here, that’s happening enough to completely obliterate the usefulness of the metric – at least in some circumstances.

Here’s a quick hypothetical example: At baseline, a hospital has 1,000 Medicare fee-for-service (FFS) discharges per quarter, with 200 of them back within 30 days. Subsequently, the hospital team and various community-based providers work together and drop the readmissions to 160 per quarter. Does the readmission rate go down to 16% under the metric? No. First, they no longer have the 40 readmissions that are also admissions and in the denominator. But more important – the very things that are reducing the readmission rate also affect the likelihood of coming back in 45 days, or 6 months, or ever! Patients are supported in learning to take care of themselves and to advocate for themselves in the care system, they make good care plans (including advance care plans), and they encounter a more supportive care system in the community. These things are still affecting the patient many months after the hospitalization. Indeed, as the care system learns how to support fragile people in the community better, fewer patients will need to come to the hospital in the first place. The result for our hypothetical hospital is that it ends up with 800 discharges per quarter, and it has not budged its readmission rate! Officially, it has not improved, even though the work done by the hospital, by patients and families, and by community-based providers has improved care substantially, and has saved millions of dollars for Medicare. Yet, using the current flawed metric, the hospital is still likely to be penalized for having a high rate of readmissions!

This is not a new observation. The first sizable pilot project that CMS sponsored involved 14 communities, and the readmissions/discharges metric functioned so poorly that the outcome measure was changed during the project to a population-based measure: readmissions per 1,000 Medicare FFS beneficiaries in the geographic community [See: http://jama.jamanetwork.com/article.aspx?articleid=1558278]. That measure works to track changes in the experience of those living in a community, but it does not help in assigning credit or blame to particular providers (unless there is only one provider in the area). It is intrinsically community-anchored. The rub is that while good care of frail, chronically ill persons is at heart a community endeavor, Medicare has few tools to incentivize or penalize communities.

Furthermore, it is not clear what the “right rate” of readmissions should be. Very little work has been published on how well the various metrics perform in various circumstances, though NQF has a score of new ones under consideration [See: http://www.qualityforum.org/ProjectDescription.aspx?projectID=73619]. The hospital penalty measure has a very complicated risk adjustment, but should the population-based measure also be risk-adjusted (perhaps at least for the population age structure and whether the person is in Medicare due to disability or age)?

The problem here is more urgent than other controversies regarding the Medicare readmission measure such as higher readmission rates in disadvantaged populations and whether communities with low total hospital utilization should be expected to have higher readmission rates. In the case of measuring change, the measurement flaw directly punishes hospitals and communities for doing what the Affordable Care Act and the Medicare Readmissions Reduction Program otherwise encourage them to do: reduce preventable hospitalizations.

What should a responsible system manager like Medicare do? Below are some suggestions.

In the short-term:

  1. Quickly sort out how to exclude certain contexts, perhaps as part of risk adjustment – e.g., whether CMS is authorized to limit application of the readmissions/discharges metric through regulation, or whether the issue has to go back to Congress.
    1. For safety net hospitals – don’t penalize hospitals primarily serving poor beneficiaries.
    2. For reducing admissions – see which of these approaches works best (or combine them)
      1. Hospitals with declining admissions (and the same bed size), when the decline is at roughly the same rate (or more) than declining readmissions
      2. Hospitals with >50% of their Medicare FFS utilization in counties with admission rates in the lowest quartile in the nation
  2. Allow hospitals in a particular geographic area to propose accountability for a population – jointly or singly – so long as they together supply more than, for example, 70% of the hospital use for that population. Then measure their success on a population basis (readmissions/1,000 relevant people living in the area/quarter, and admissions/1,000/quarter)

In the longer-term:

  1. Develop useful metrics for continuity and quality of care, especially for:
    1. Reliability, patient/family sense of trustworthiness/preparation; and
    2. Patient/family driven care plans, evaluated for quality with feedback
  2. Develop useful metrics for the global costs of care, including private and Medicaid costs, for longer terms of illness, not depending upon hospitalization as the trigger, and including long-term services and supports.

What Can You Do Now?

If you agree, let’s talk about how to make improvements to the metric with the National Quality Forum, CMS, hospitals, and other interested organizations and colleagues. Feel free to add comments and suggestions here, too. Let’s build a commitment to evolving toward measures that really reflect optimal care, rather than staying with the under-performing and often misleading ones we have.

Want to know more?

Jencks et al.’s New England Journal of Medicine article on readmission statistics:
http://www.nejm.org/doi/full/10.1056/NEJMsa0803563

The Hospital Readmissions Reduction Program:
http://www.cms.gov/Medicare/Medicare-Fee-for-Service-Payment/AcuteInpatientPPS/Readmissions-Reduction-Program.html

The Community-based Care Transitions Program:
http://innovation.cms.gov/initiatives/CCTP/

twitterrssyoutube
Aug 232012
 

The P2 Collaborative of Western New York [name was changed to Population Health Collaborative in 2017] represents a different spin on the Community-based Care Transitions Program (CCTP) model. It is unique in its focus on a very rural area of Western New York, and is unusual in that it is one of a few  community-based organizations in CCTP that is NOT an Area Agency on Aging. P2 is a non-profit regional health improvement collaborative, with origins as a Robert Wood Johnson-funded Aligning Forces for Quality community project. Through that work, it has engaged in various activities within eight counties in Western New York.

As Megan Havey, Manager of Care Transitions, explains, “P2 doesn’t provide direct services, but acts as a facilitator to members of the collaborative.” The scope of the project really called for coordination by a regionally based group, one that could work with and understand the diversity of partners, and that could offer the sort of infrastructure support that such a collaborative would require.

The collaborative is one of the largest in the CMS CCTP portfolio. It includes eight local community-based organizations (CBOs) and ten hospitals, and works with other community agencies, organizations, and foundations including the Health Foundation for Western & Central New York, IPRO (the QIO), the Alzheimer’s Association, local  hospice organizations, and county health departments.  The work sprawls across seven counties, with programs that aim to serve more than 2,600 patients annually. The diversity of participating organizations is remarkable, ranging from a 5-bed to a 150-plus-bed hospital.

Over the last six years, many of the participating organizations had participated in pilot programs to improve care transitions. Other groups had little experience, but, Havey says, “…were in a great position to be mentored by groups that had experience.” In building the application, IPRO helped with many tasks, such as creating templates to conduct the required root-cause analysis, analyzing admissions data, and convening partner organizations. Havey says that although IPRO has now “stepped back” from the project, P2 continues to solicit IPRO for technical assistance and support.

The application process was instructive, Havey says, in helping the partners to appreciate just how flexible the project would need to be. “Each county had a very different target population and model,” she says. “It was important  to be able to engage partners and obtain their buy in, but also to be realistic about what we could achieve in each county. We could not create a cookie cutter model.” All of the local CBOs and hospitals are using the Coleman model, the Care Transitions Intervention™, and are targeting Medicare Fee-For-Service patients.

Havey says that developing a web-based data platform that all partners could use has been an essential step. The platform had to accommodate the range of reporting capacity partners bring to the project. To that end, P2 worked with a software company to invest in and develop a platform all hospitals could use to enter data about eligible patients. The system operates within the context of the Care Transitions Intervention, and allows care managers to document data about home and hospital visits, as well as follow-up calls and evaluation information.

Havey notes special challenges in serving a rural population, particularly in terms of accessing care. There are not enough providers, she says, and transportation to get to them can be difficult. “Rural counties have very poor health outcomes, with many medically underserved areas and populations. Our goal is to reduce readmission rates with an intervention that leads to better health outcomes and improves quality of life.”

Key words: care transitions, CCTP, Section 3026, rural residents, readmissions

twitterrssyoutube
Jul 232012
 

By Dr. Kyle Allen and Susan Hazelett

The Summa Health System/Area Agency on Aging, 10B/Geriatric Evaluation Project(SAGE) is a collaboration between an integrated health system and the local Area Agency on Aging which was begun in 1995. SAGE  provided the organizational structure to develop the resources and processes needed to effectively integrate geriatric medical services and community-based long-term care services. Such integration is essential to bridging gaps between acute medical care and community-based care, enabling medical and social services providers to reach frail older adults living in the community with multiple chronic conditions, and to improve their quality of life. The SAGE project, which operates in the Akron, Ohio, metropolitan area, has managed to do just that. Results of the 17-year collaborative indicate that consumers, health care systems, health care providers, and payers have all benefited from the focus on integrating service delivery.

In the early 1990s, Summa Health System (SHS), an integrated not-for-profit health delivery system, had launched several projects aimed at improving care for frail elders. Summa comprises six community teaching hospitals with more than 2000 beds, as well as its own health plan, skilled home care, hospice, and a foundation. Summa’s insurance plan has 150,000 covered lives, including a Medicare Advantage Plan of 23,000.One of the projects being tested at Summa was the ACE (Acute Care for Elders) model, a model of hospital care delivery aimed at improving the functional status and clinical outcomes for hospitalized older adults. Recognizing that this model did not have the necessary patient connection in the outpatient setting, Summa realized it would need to expand its reach to elderly patients across the continuum of care. To this end, it created the Center for Senior Health (CSH), an outpatient consultative service that supports primary care providers by offering an interdisciplinary, comprehensive geriatric assessment; high-risk assessment; a geriatrics resource center; a clinical teaching center; inpatient geriatric consultation and outpatient consultation followup. The CSH attempts to treat and reach the whole patient by addressing acute and chronic medical needs, psychosocial needs, and family concerns. Despite the range of services provided, the CSH continued to be limited in its scope because it did not have access to patients in their homes, nor could it provide long-term case management. As a result, it began to rely increasingly on community-based long-term care agencies for this kind of information and management.

At about the same time, the Area Agency on Aging 10B, Inc. (AAA) found itself managing a growing number of consumers with functional decline, geriatric syndromes, and multiple chronic illnesses. The AAA, which serves more than 20,000 elders in Northeast Ohio, recognized that it needed to be better integrated with the acute medical sector if it were to achieve its goal of delaying and preventing nursing home admissions.

Leaders from Summa Health and the AAA recognized the challenges and deficits each one faced in providing continuity of care to patients/consumers, and began meeting to discuss how they could build a new, integrated model of care. They realized that they shared a common goal and vision to improve care for frail elders, and launched SAGE, which provided the organizational structure needed to effectively integrate their services. SAGE had no grants or funding, just a spirit of collaboration and cooperation, and a common desire to do more than just business as usual.

A SAGE task force was created comprised of staff from both organizations, including physicians, nurses, and social workers, as well as senior leaders, to promote communication, provide feedback, and create initiatives that linked the two. The group met monthly for two years, and now meets quarterly. Among its early objectives were the development of protocols to screen and identify at-risk older adults, to establish mechanisms for information sharing and resources, to identify gaps and duplication in service delivery, to locate a AAA case manager at the CSH, to educate staff from both organizations, to collect data and information, and to identify and address barriers to implementation.

Eventually SAGE created an RN care manager assessor program, in which placed an AAA assessor in the acute care hospital. The assessor works closely with the ACE team to identify hospitalized patients who can benefit from community-based programs, as well as patients who are eligible for PASSPORT, the state’s Medicaid waiver program. This was a new initiative for the AAA, which had traditionally conducted these assessments post-discharge, in the patient’s home. That assessment now occurs before the patient is even discharged from the hospital, thus helping to determine needs for  community based services and facilitating the process for eligibility  and approval for Medicaid long term care benefits.  This is beneficial because patients will typically receive Medicare covered services for skilled needs but long term care needs are not addressed as well and the Medicare skilled benefits are provided for only a limited time usually < 30 days.   Without the other supports this vulnerable population is at risk for poor health care access, emergency department visits and  hospital readmission. The AAA then assumes case management for the consumer, and offers periodic geriatric follow-up.

This program has facilitated improved capacity management for complex patients in the acute care hospital. It improved AAA communication with primary care and hospital staff, reducing repeat hospitalizations, ED visits, and nursing home placements. It improved outcomes for complex patients, and decreased discharges from PASSPORT to nursing homes. During the pilot period,  referrals to and enrollments in the PASSPORT program doubled.   The AAA was also successful in replicating this model at other hospital systems in the Northeastern Ohio AAA service area.  A more recent positive outcome  related to this collaboration work was the awarding for AAA 10b Inc. one of the first seven  Community Based Care Transitions projects from CMS/CMMI as part of the The Community-based Care Transitions Program (CCTP), created by Section 3026 of the Patient Protection and  Affordable Care Act

In developing SAGE, several barriers had to be overcome, primarily those affecting leadership of the program, development of an effective multidisciplinary workgroup, and resources (in terms of staff time). The program can be adapted by other communities around the country, offering their acute medical system and community-based programs a way to align their services and collaborate in ways that better address the needs of frail older adults.

Key words: community collaboration, SAGE Project, ACE Units, CCTP, 3026, pilot programs

twitterrssyoutube
Feb 232012
 

CJE SeniorLife, a community-based organization that serves some 18,000 older adults annually, is among the first cohort of recipients for  Section 3026 or  Community-Based Care Transition Program (CCTP) funding from the Centers for Medicare and Medicaid. One of seven early awardees, CJE will anchor a project that includes three large hospitals in Northern Chicago, as well as long-term services and supports organizations that serve frail older adults.

Medicaring talked to Heather O’Donnell, JD, LLM, CPA, then CJE’s Director of Planning for Healthcare Reform. She said that the process that led to funding has been underway for more than a year, and began when the group first began to consider opportunities that were arising as a result of health care reform, and how it might further its effort to bridge gaps between social services and medical care.

CJE, which had already been involved in care transitions improvement efforts, began to reach out to hospitals in its community, approaching them to find out whether they would be interested in partnering for the CCTP opportunity. Ultimately, three hospitals were selected:  Northwestern Memorial Hospital (a major academic medical center), Provena-Resurrection Saint Joseph Hospital, and Provena-Resurrection Saint Francis Hospital. The team also includes Telligen, the Illinois Quality Improvement Organization and local Care Coordination Units. These state-run units, housed in communities throughout Illinois, address the needs of older adults who have complex, ongoing health care needs. Patients who have  diagnoses of pneumonia, congestive heart failure, or AMI are targeted, as well as those who have complex conditions or take multiple medications.

The intervention is based on Eric Coleman’s model, which focuses on coaching patients and families to improve self-management skills for chronic conditions and medication management. The 30-day intervention aims to help people access home and community-based services and features a follow-up home visit by a transitional care nurse within 72 hours of discharge. These nurses, who have participated in the Care Transitions Intervention training program, help patients and families to set 30-day post-discharge goals, and to make and keep followup appointments. In addition, CJE received foundation funding which is enabling it to include a social work intervention; very high risk patients are identified and receive followup with a social worker for six months post-discharge.

“We had to adapt the Coleman protocols,” says O’Donnell. “We felt that for some patients, those with chronic conditions and psychosocial problems, thirty-days of followup were insufficient. We found that about 10 percent of the patients in our program would need more support services. That part of our program is not covered by CMS but is funded with private foundation funds.”

O’Donnell says that pulling the project together has taken a great deal of collaboration with the participating hospitals—from the on-the-ground work of finding the right contact people to developing specific strategies for the intervention. “But we felt that this was a good fit with what the hospitals were already doing,” she said. “It is very exciting work, getting every provider in the community to think about the quality of care from the standpoint of preventing an unnecessary readmission.”

Asked whether there had been any problems in bridging the divide between social services agencies and hospitals, O’Donnell said there had not. “This isn’t about us versus them. This is about everybody pulling together and undertaking a new initiative that’s good for everybody—good for the hospital, the nursing home, the patient. It’s a new approach.”

CJE meets regularly with its partners at each participating hospital, although the three are some miles apart and there is no reason to try to pull them all into one meeting. Orchestrating such a meeting, O’Donnell said, would be quite difficult, given how busy people are, and how hard it is to accomplish specific tasks when so many people are involved. “We’ve found it’s more effective to address each hospital and their concerns and our strategies individually.” CJE is, however, convening quarterly meetings of participating nursing homes, at which it hopes participants will talk about their successes, challenges, and processes. CJE is also mindful of the role to be played through partnerships with its local AAA (Area Agency on Aging), which is in the midst of applying for separate CCTP funding. It is also keeping the Department of Health Care and Family Services apprised of its work.

The process of actually launching the program took several months of work with CMS to address questions and concerns and finalize a contract. The application, submitted in August, received final approval in November. The first wave of projects will begin in one hospital on March 1, with other hospitals launching in April and May; ultimately, the project anticipates serving some 2,700 people each year.  As O’Donnell notes, “It is a significant undertaking, and there are lots of details to be sorted out.”

She also noted that the relatively quick launch can be attributed in part to ongoing planning for implementation, addressing in advance issues that were likely to come up as the project rolled out. “We had these conversations internally and with hospitals before the application was even approved.” 

Key words: care transitions, Section 3026, CCTP, CMS, Coleman model, CJE


twitterrssyoutube
Dec 052011
 

Patients just discharged from the hospital urgently need rapid follow-up in the community. Dr. Joanne Lynn describes the care coordination needed among patients, community providers, hospitals, and other settings, and what’s needed to make it work.

Key words: rapid follow-up, care transitions, discharge planning, quality improvement, rehospitalization

twitterrssyoutube
Nov 282011
 

The Southwest Ohio Care Transitions Collaborative, one of 7 sites chosen by the Centers for Medicare and Medicaid for the first cohort of 3026 funding, had lots going for it as it pulled together a broad-based community health coalition and implemented strategies to reduce avoidable readmissions for older adults. The program brought to its application a coalition that included major community-based organizations, the local hospital association, and five hospitals serving the Greater Cincinnati area. It had demonstrated success with a care transitions pilot program based on the Coleman model, and it submitted an application to CMS that clearly explained the strategy behind its blended rate calculations. The Collaborative estimates that it will serve some 5,400 seniors each year, with a cost savings to Medicare of more than $1 million. The specific intervention is built directly on the Coleman model, with some modifications to account for local needs and experiences.

The application built on the success of a pilot project implemented at UC Health University Hospital, which showed that participants had a lower-than-average readmission rate, and that most patients were discharged to their home or other community setting, rather than to a skilled nursing facility. Sharon Fusco, Director of Business Results and Innovation for the Council on Aging of Southwestern Ohio, is optimistic that the care transitions intervention will significantly reduce readmissions among hospitalized Medicare beneficiaries with diagnoses that include pneumonia, heart failure, heart attack, or multiple chronic conditions.

In building the coalition, Fusco says the group aimed to be certain to include all of the organizations that could influence and affect patients’ lives; where the root cause analysis identified gaps in care, the coalition took care to find organizations that could fill them. As a result, the coalition now includes the Greater Cincinnati Health Council, which is the local hospital association; a health information and technology exchange organization; a program that helps to coordinate patient access to physicians; and a local mental health and recovery services board.

The Collaborative used its root cause analysis to identify gaps in care, and to consider strategies that would mitigate problems. So, for instance, as Fusco explained, the root cause analysis identified mental health issues as a significant barrier to patient involvement in discharge planning and follow-up. “We had to find a way to help these individuals, and to connect them to a mental health medical home,” Fusco explained. To that end, the mental health board was enlisted, and will play a critical role in assisting patients whose mental health problems present barriers to good care.

The analysis also found tremendous problems in medication reconciliation, a problem that affected more than 90% of patients in a pilot at University Hospital. In exploring this issue more deeply, the Collaborative found that many patients did not have relationships with or access to primary care physicians, a real barrier in trying to help hospitalized patients make and keep important follow-up appointments. To this end, the Collaborative involved a group that focuses on coordinating patient access to physicians.

In general, the Collaborative found that the Coleman Model matched most of its needs in responding to problems identified by the root cause analysis. The Council on Aging added a fifth pillar to the four pillars of the Coleman model home and community-based programs for which some patients might be eligible. Meals, home care assistance, and transportation are among the services these programs offer.

Fusco and  her colleague, Communications Director Laurie Petrie ,anticipate that the Collaborative will encounter some challenges in with regard to operations and technology  differences among participating hospitals (e.g., rural versus urban settings), and to the ramp-up of health information technology  systems. Fusco noted that one challenge will be “getting the right staff and the right tools to each hospital.” But she is confident in the Collaborative’s ability to overcome  these  barriers and deliver successful interventions.

Fusco offered some advice for other potential applicants. In particular, she advises that groups take time to explain in detail how they calculate their blended rate, “really spend time explaining the rate and what goes into it.” According to Fusco, the process of calculating the blended rate was difficult but critical. She said,  “The process of [pulling together this application] turned out to be a healthy exercise for us. Costing out all the inputs that go into providing this service was challenging and time consuming, but completely necessary. We built a cost model that allowed us to account for both fixed and variable costs. In the end, the process increased our learning, and we found it very beneficial.”

She advises other potential applicants to be thoughtful and meticulous as they develop their calculations. “You need to understand what your costs are, what’s fixed and what’s variable. Then you can plug in the numbers. But you have to think about everything that goes into serving a client—what does it cost you to actually run the intervention? Not just the face-to-face time with the client, but all of the rest of the costs.”

She also feels that the Collaborative’s application was stronger for having been reviewed and critiqued by external partners, individuals with no connection to the program being proposed. To that end, she said, consultations on aspects ranging from policy to cost were helpful.

Key words: care transitions, CCTP, Section 3026, award sites, community coalition, quality improvement

twitterrssyoutube
Oct 242011
 

Dr. Joanne Lynn describes Project RED (Re-Engineered Discharge), a program developed by Dr. Brian Jack and his colleagues at Boston University. It is designed to help hospitals to re-engineer their discharge processes, and offers some free online materials and guidance, as well as IT-enabled patient transition aids. You can read more about the details of the program on its website at: http://www.bu.edu/fammed/projectred/

And you can listen to Dr. Lynn describe it below.

Key words: Care transitions, discharge planning, health information technology, Project RED

twitterrssyoutube