Dec 162014
 

by Stephen F. Jencks, M.D., M.P.H.

[Also see companion post by Joanne Lynn, M.D.]

Issue.

The Medicare Readmission Reduction Program (MRRP) encourages hospitals to reduce readmissions within 30 days of discharge by imposing substantial financial penalties on hospitals with more readmissions than would be expected if the same patients were discharged from an average hospital.[1] But some hospitals and communities have succeeded too well and reduced discharges even more than readmissions so that their readmission rates, as currently calculated, do not improve much, which puts them at higher risk for penalties. There are two underlying problems:

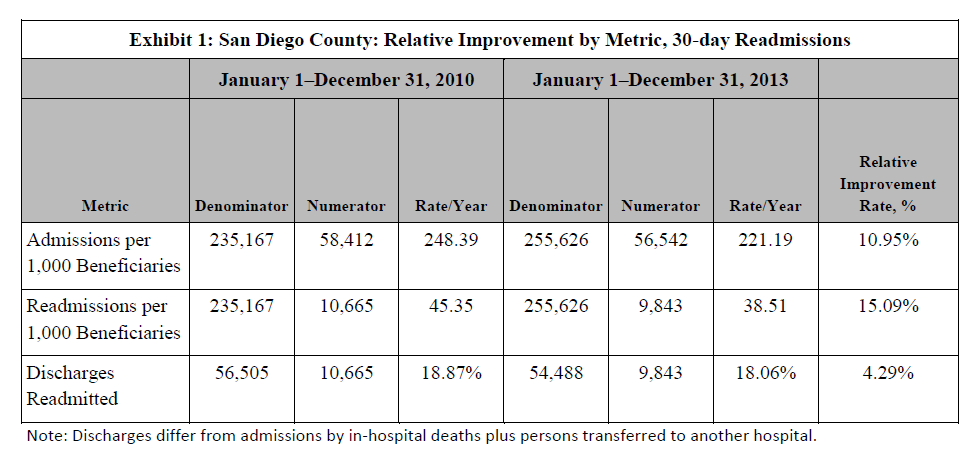
First, there are two ways of thinking about, and therefore measuring, the rate of readmissions; and they often lead to quite different results and quite different decisions on penalties. One is discharge-based; the other, population-based. The relationship between the two is simple: (readmissions/discharges) X (discharges/(beneficiary population (1,000s) ) ) = readmissions / (beneficiary population (1,000s))

Patients who are admitted but die during hospitalization or are transferred to another hospital are not counted as discharges from the first hospital.

Second, effective interventions to reduce 30-day readmissions have an effect on admissions that extends far beyond 30-days after discharge and they reduce a lot of other admissions, especially if implemented in partnership with community providers and services.

When Congress created the MRRP, many stakeholders had become aware (and dismayed) that 20% of people enrolled in Medicare fee-for-service and discharged from a hospital were readmitted within 30 days of hospital discharge. Clinical trials had shown that improved processes around hospital discharges could prevent many of these readmissions. The aim of establishing accountability also made a hospital focus desirable. In this view, readmission is a burden resulting from poor hospital discharge processes, whether clinically premature or poorly executed. With that emphasis on discharge processes as cause and cure for readmissions, it was natural for the Centers for Medicare & Medicaid Services (CMS) to choose to estimate each hospital’s expected readmissions as the number of patients whom the hospital discharged and who would be expected to be readmitted after discharge from an average hospital. Most readmission reduction initiatives use this discharge-based readmission rate to measure performance. This discharge-based perspective effectively defines the readmission rate as the percentage of discharges that are followed by a readmission. In this way of thinking, the number of hospital discharges is simply a fact of life, much like the fact that a year has 365.24 days. This view does not see that hospital actions might reduce the number of patients they discharge, and this blind spot causes trouble.

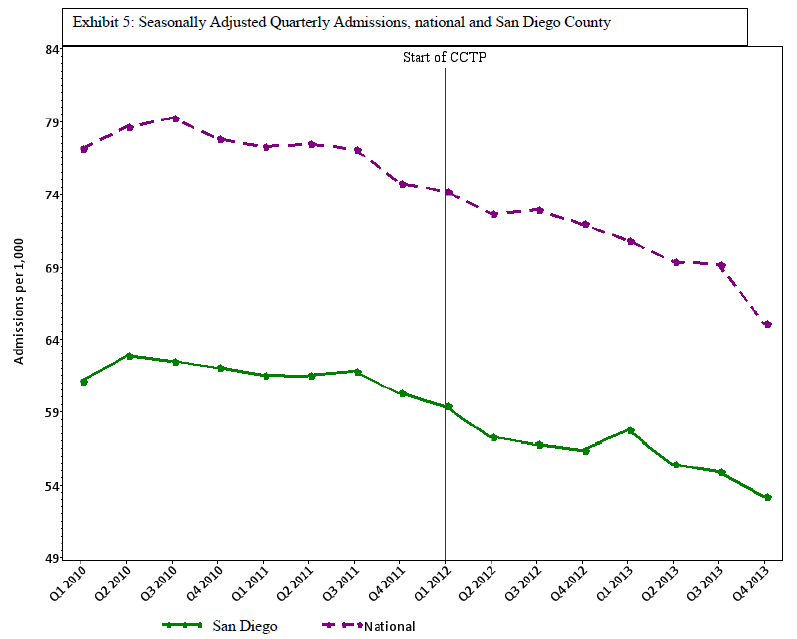
Hospitals actually have a great deal of influence on how many patients they admit and discharge because so many of their discharges are admitted through their emergency department or by hospital-affiliated physicians and because they can collaborate with community services and providers who can forestall patients even coming to the hospital. Population-based hospital discharge rates vary substantially across regions, and they can change over time.

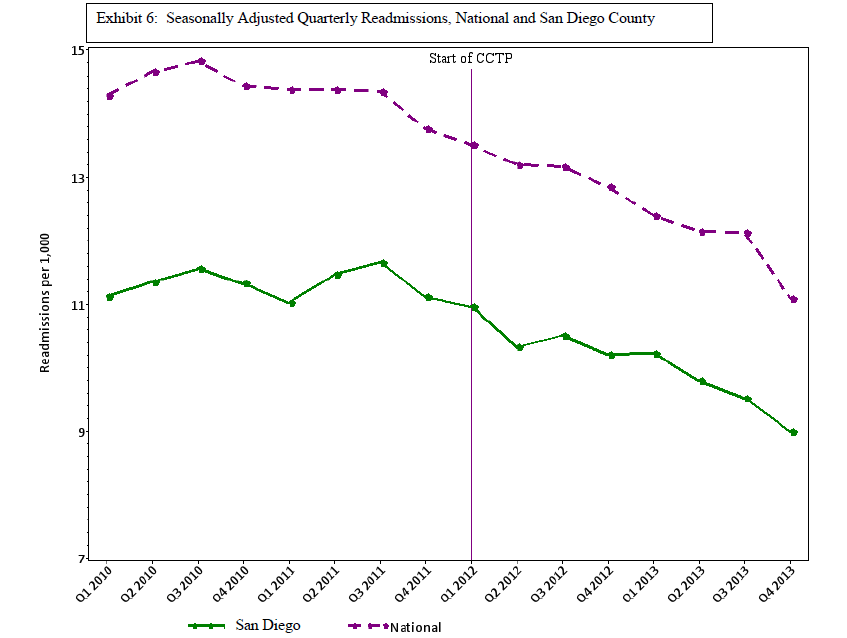
Some policy makers worried that the discharge-based rate could behave in unexpected ways if hospitals took steps that reduced total discharges by more than the reduction in 30-day readmissions. As a result, several programs, such as the Partnership for Patients and the Quality Improvement Organizations’ (QIOs) Care Transitions Program, were designed using a population-based readmission rate or converted to such a rate after evaluating early findings. The population-based rate is the number of readmissions for every 1,000 fee-for-service Medicare beneficiaries in the hospital’s service area. This view sees readmissions as a community health problem, a burden on a population of beneficiaries and the Medicare trust funds that is associated with that population’s use of hospitals just as hospital-acquired infections are associated with use of hospitals. From this perspective, preventing hospitalizations, improving discharge transitions, and improving post-discharge care are equally valid ways to reduce readmissions. Whether the hospital reduced hospitalizations in order to reduce readmissions is less important than being sure that we do not penalize hospitals for taking such steps. Population-based rates are closely aligned with the three-part aim of the National Quality Strategy (individual care, population health, and affordability), not only because they are population-based but also because they reflect the close relationship between care in the community and a hospital’s apparent performance.

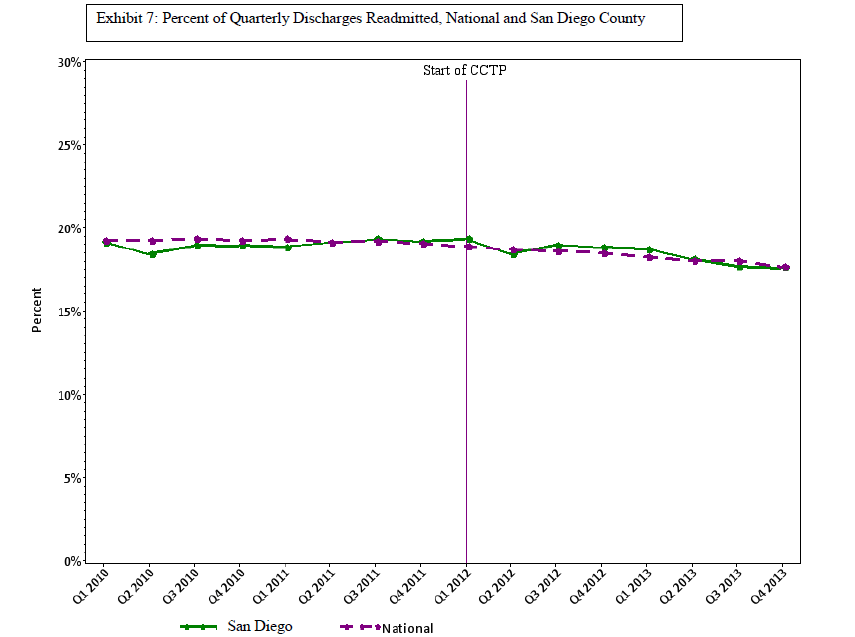
Thus, a program can reduce burdens on beneficiaries and Medicare through significant reductions in the population-based discharge and readmission rates but see much smaller reductions in the discharge-based readmission rate. In a companion blog to this piece, Joanne Lynn presents evidence that this attenuation of changes in discharge-based rates has happened repeatedly in community-based readmissions programs. We do not know, at this point, whether attenuation of changes translate into financial penalties but it seems very likely to increase a hospital’s risk.

We also do yet fully understand what specific changes produce these decreases in the population-based discharge rate, but the most parsimonious explanation is that the causes are pretty much the causes of reduced readmissions: Provide urgent care with support for keeping the patient in the community, and you are likely to reduce all admissions, not just readmissions. Enroll more patients in medical homes, and the benefits will not disappear 30 days after hospital discharge. Improve nursing home communications with emergency rooms, and the benefits will not be limited to patients within 30 days after hospital discharge.

What we can foresee is that hospitals, already wary of readmissions reduction because it directly reduces revenue, will become doubly wary if they conclude that reducing discharges may also cause or increase the MRRP penalty. If CMS is penalizing hospitals and communities for succeeding at improving care and reducing costs, the reaction may threaten a very successful set of initiatives. The examples we report are for community-based efforts to reduce readmissions. Hospital-level calculations are generally beyond our capability. CMS can, however, easily determine whether, all else being equal, penalties are more likely or larger in areas where the population-based hospital discharge rate is declining substantially than elsewhere. That information is urgently needed.

What to do.

The purpose of the MRRP is to reduce the burden of readmissions on Medicare beneficiaries and the Medicare trust funds, so the important indicator of progress is the number of readmissions, not the percentage of discharged patients that are readmitted.

Healthcare quality measurement needs to catch up with the National Quality Strategy and add measures of the impact of care on the health of the population that will complement measures of the quality of individual episodes of care such as hospitalizations. In the case of readmission measurement for the MRRP, this need is substantially more urgent because there is good reason to fear that a hospital that engages with its community and does exactly what the MRRP hopes for is more liable to financial penalties under the current, discharge-based measure than it would be under a population-based measure.

The first step is to assess the degree of urgency by examining national evidence on actual penalties. If unreasonable penalties are at all frequent then the problem is far more urgent. This will be complex, because Epstein has already shown in cross-sectional studies that population-based hospitalization rates and readmission rates are positively correlated.[2] At the same time it will be important to develop population-based measures of readmissions and compare their impact on penalties with the impact of discharge-based measures. The obstacles are bureaucratic, technical, and political.

Bureaucratically, the most important obstacle has been a widespread belief that the Patient Protection and Affordable Care Act requires calculating discharge-based rates. In fact, the Act says only that penalties are to be determined from the ratio of observed to expected numbers of readmissions and is silent on how the expected number is to be calculated. The other bureaucratic problem is less tractable: Under current procedures, the steps laid out for implementing a new measure, both at CMS and at the National Quality Forum (NQF) would likely take several years. The process should be expedited if the analysis of current penalties indicates that hospitals are being penalized for success in reducing admissions.

The technical challenges of creating a population-based readmission measure for hospitals are substantial. First, the procedure must find a way to measure each hospital’s population-based hospitalization rate. Second, a method of risk adjustment must be developed and applied so that population-based readmission rates for each hospital and community can be compared. Although these methods are still evolving, adjustments for factors such as neighborhood deprivation[3] are actually easier at the population level. These are difficult tasks, but a first step good enough to improve on the existing model should be possible within a year.

Politically, hospitals will be concerned about accountability for the community hospitalization rate. They will recognize that if hospitals in areas with low hospitalization rates are protected, then hospitals in areas with high hospitalization rates will be more vulnerable.

Some have hoped that traditional risk adjustment could solve this problem, because the most likely scenario is that average risk of readmission increases as the number of discharges decreases. That prospect is not promising, because the most assiduous work on risk adjustment has produced tools of only moderate power. The prospects for solving this problem with improved risk adjustment are not promising.[4],[5]

When you find yourself in a hole you should stop digging. It seems prudent for NQF to suspend endorsement of the pending discharge-based readmission measures and for CMS to delay implementing discharge-based measures if NQF endorses them until CMS has studied and reported the extent to which readmission penalties punish hospitals that are actually reducing both admissions and readmissions and has laid out an approach to any problems found. Finally, the problem identified here underlines the importance of placing a population-based foundation under at least some measures of health care system performance.

Footnotes:

[1] Centers for Medicare and Medicaid Services. Readmission reduction program. Retrieved from http://www.cms.gov/Medicare/Medicare-Fee-for-Service-Payment/AcuteInpatientPPS/Readmissions-Reduction-Program.html

[2] Epstein, A. M., Jha, A. K., & Orav, J. E. (2011 December 15). The relationship between hospital admission rates and rehospitalizations. New England Journal of Medicine 365(24).

[3] Kind, A. J. H., Jencks, S., Brock, J., Yu, M., Bartels, C., Ehlenbach, W., & Smith, M. (2014 December 2). Neighborhood socioeconomic disadvantage and 30-day rehospitalization: a retrospective cohort study. Annals of Internal Medicine 161(11) 765-775.

[4] Yale New Haven Health Services Corporation/Center for Outcomes Research & Evaluation. (2014, July). 2014 measure updates and specifications: Hospital-wide all-cause unplanned readmission – version 3.0. Retrieved from https://altarum.org/sites/default/files/uploaded-publication-files/Rdmsn_Msr_Updts_HWR_0714_0.pdf.

[5] Kansagara, D., Englander, H., Salanitro, A., Kagen, D., Theobald, C., Freeman, M., & Kripalani, S. (2011 October 19). Risk prediction models for hospital readmission: A systematic review. Journal of the American Medical Association 306(15) 1688-1698.

twitterrssyoutube
Dec 082014
 
Dr. Joanne Lynn Portrait

By Joanne Lynn M.D.

[Also see companion post by Stephen F. Jencks, M.D., M.P.H.]

Care transitions improvement programs have been effective in helping the health care system both become more effective in serving people living with serious chronic conditions and reduce costs. However, the key metric used to measure performance is seriously malfunctioning in at least some hospitals and communities, leading to penalties and adverse publicity for providers and communities that are actually performing well and continuing to improve performance. In this post we provide supporting data, and a companion blog article provides a thoughtful discussion of the conceptual issues underlying this troubling malfunction. For our earlier blog post about this problem see: https://medicaring.org/2014/08/26/malfunctioning-metrics/.

Very simply, this problem arises because the metric used is some variant of readmissions (within 30 days) divided by discharges (from a particular hospital) within a particular period. Thus, the usual metric is something like “20% of Medicare fee-for-service (FFS) hospitalizations are followed by a readmission within 30 days.” This metric works well if the denominator, namely the number of hospitalizations, is not affected by the improvements that reduce the risk of readmission. If the denominator declines along with the numerator, the metric will not reflect the degree of improvement that was actually achieved. The data below show that this happens in real situations.

We are here showing the data from San Diego County, a very large county with about 250,000 Medicare FFS beneficiaries, who had about 60,000 Medicare FFS admissions to hospitals per year and about 10,000 readmissions per year in 2010, when almost all of the hospitals and the county’s Aging & Independence Services (functioning as the Community-based Care Transitions Program partner agency/Area Agency on Aging/Aging and Disability Resource Center) started working together to improve care transitions and reduce readmissions under the San Diego Care Transitions Program, one of the Community-based Care Transitions Programs initiated by Section 3026 of the Patient Protection and Affordable Care Act. The application year was 2012 and the start-up year was 2013. The table below shows an initial summary of their results, provided through their Quality Improvement Organization.

Exhibit 1: San Diego County: Relative Improvement by Metric, 30-day Readmissions

Exhibit 1: San Diego County: Relative Improvement by Metric, 30-day Readmissions

Readmissions of county Medicare FFS residents fell by 15% in 2013, compared with 2010. San Diego County reduced hospitalizations by 11%. However, when the numerator and denominator go down at nearly the same rate, the fraction moves just 4.3%, which falls far short of the 20% reduction goal that Medicare has set.

What follows are the quarterly data from San Diego. The first graph, Exhibit 2, shows the quarterly rate of admissions per 1,000 Medicare FFS beneficiaries in San Diego County. We have adjusted these data for the effects of seasons on admissions (since there are usually more admissions in the winter). The shaded portion shows the “control limits,” an area which represents the expected range of variation demonstrated in the first 3 years of the data (2010-2012). Data that fall outside of the range or that consistently run on one side of the midline indicate that something has changed in how the system is functioning. Clearly, admissions are falling.

San Diego Seasonally Adjusted Admissions

Exhibit 2: San Diego Seasonally Adjusted Admissions

The second graph, Exhibit 3, shows the readmissions rate in the same framework – quarterly rate of readmissions per 1,000 Medicare FFS beneficiaries in San Diego County, adjusted for seasonality. The control limits again show change. Readmissions are falling.

Exhibit 3: Seasonally Adjusted Readmissions

Exhibit 3: Seasonally Adjusted Readmissions

The third graph, Exhibit 4, shows the metric in the conventional form, readmissions divided by discharges. The graph does eventually show a decline, but only a modest one. The fact that the denominator was falling attenuated the impact of the falling number of readmissions.

Exhibit 4: Seasonally Adjusted Percent Discharges with 30-day Readmissions for San Diego County, by quarter

Exhibit 4: Seasonally Adjusted Percent Discharges with 30-day Readmissions for San Diego County, by quarter

The next three exhibits show the comparison of the San Diego measures with the national rates for the same metrics. Exhibit 5 shows that San Diego County is dramatically less likely to have Medicare FFS beneficiaries in the hospital than the nation as a whole: 56 per 1,000 per quarter in San Diego, compared with 69 per 1,000 per quarter nationwide. Exhibit 6 shows that San Diego is also much lower in readmissions than the national average: 10 per 1,000 per quarter in San Diego, compared with 12 per 1,000 per quarter nationwide. In both cases, the declining use is reasonably parallel between San Diego and the nation. This would imply that improvement strategies are still being effective at this lower range, and thus the lower range is not yet a limit on improvement opportunities. Exhibit 7 shows that San Diego County’s conventional metric of readmissions divided by discharges simply tracks the national average. Clearly, the metric is not functioning in a way that reliably separates good practices from wasteful ones. That readmissions over discharges metric does not convey the fact that San Diego is much less likely to hospitalize and to rehospitalize. Indeed, 10 of the 14 San Diego hospitals eligible for penalties for high readmission rates are being penalized next year. Since the calculations that go into determining the hospital penalty focus on particular diagnoses in three past years, it is possible that these hospitals manage to do badly with those diagnoses in those years, but it seems quite unlikely. More plausibly, the metric used is of the readmission divided by discharge form, so the shrinking denominator will affect this calculation.

Exhibit 5: Seasonally Adjusted Quarterly Admissions, National and San Diego County

Exhibit 5: Seasonally Adjusted Quarterly Admissions, National and San Diego County

Exhibit 6: Seasonally Adjusted Quarterly Readmissions, National and San Diego County

Exhibit 6: Seasonally Adjusted Quarterly Readmissions, National and San Diego County

Exhibit 7: Percentage of Quarterly Discharges Readmitted, National and San Diego County

Exhibit 7: Percentage of Quarterly Discharges Readmitted, National and San Diego County

Without access to and analysis of much more data, one cannot know how widespread this problem is. We do know that San Francisco had an admission rate of just 50 per 1,000 per quarter in 2013 and a readmission rate of just 8 per 1,000 per quarter, which are rates much lower than San Diego. Yet 8 of San Francisco’s 10 eligible hospitals will be penalized for excessive readmissions in 2015. Furthermore, we know that the initial Medicare foray into this work, published in the Journal of the American Medical Association in January 2013 (link: http://jama.jamanetwork.com/article.aspx?articleid=1558278&resultClick=3 “Association Between Quality Improvement for Care Transitions in Communities and Rehospitalizations Among Medicare Beneficiaries”, see “Outcome Measures”), involved 14 smaller communities, and that project had to change from using the discharge-based metric to using the population-based metric when it became clear that the shrinking denominator was making the project monitoring unreliable.

Hospitals, other providers, and communities that believe they may be adversely affected by the malfunctioning metrics should have access to the data needed to investigate and CMS should welcome reconsideration of those situations. NQF should suspend endorsement of new readmission/discharge metrics and re-examing existing ones. CMS has multiple contractors working on readmissions, and some have substantial experience and skills in the technical details of these metrics. CMS should quickly modify their contracts to require them to investigate the extent of this problem, to identify steps to ameliorate adverse impacts of the current readmissions/discharges metrics, and to build the metrics that can guide care transitions work into the future. Certainly, the time has come to sort this out and develop metrics that reliably separate exemplary from persistently inefficient practices.

Want to know more?

“Protecting Hospitals that Improve Population Health” by Stephen F. Jencks.
https://medicaring.org/2014/12/16/protecting-hospitals/

“Senior Alert: A Swedish National Dashboard for Preventitive Care for the Elderly” by Elizabeth Rolf.
https://medicaring.org/2014/12/22/senior-alert/

twitterrssyoutube
Aug 262014
 

By Joanne Lynn and Steve Jencks

Work to reduce readmissions has started to yield remarkable improvements in integration of care for frail elderly people – by prompting hospital personnel to talk with community-based service providers, by teaching patients and families how to manage conditions and navigate the health care system more easily, and by paying more attention to trying to fill gaps in the community’s services. But the measure being used to track improvement is seriously misfiring in some settings, and if CMS does not mitigate the adverse impacts, they may become destructive to the momentum and the good that has been done. This is much more than an issue of imperfect risk adjustment or inadequate identification of planned readmissions: it is a punitive error that undermines program goals.

Since CMS mostly aims to assign responsibility for readmissions to the discharging hospital, the key metric has been the risk of readmission for the average person discharged, which is the number of readmissions, divided by the number of live discharges. Any time outcomes are monitored with a ratio, one has to watch out for whether interventions that affect the numerator also affect the denominator. Here, that’s happening enough to completely obliterate the usefulness of the metric – at least in some circumstances.

Here’s a quick hypothetical example: At baseline, a hospital has 1,000 Medicare fee-for-service (FFS) discharges per quarter, with 200 of them back within 30 days. Subsequently, the hospital team and various community-based providers work together and drop the readmissions to 160 per quarter. Does the readmission rate go down to 16% under the metric? No. First, they no longer have the 40 readmissions that are also admissions and in the denominator. But more important – the very things that are reducing the readmission rate also affect the likelihood of coming back in 45 days, or 6 months, or ever! Patients are supported in learning to take care of themselves and to advocate for themselves in the care system, they make good care plans (including advance care plans), and they encounter a more supportive care system in the community. These things are still affecting the patient many months after the hospitalization. Indeed, as the care system learns how to support fragile people in the community better, fewer patients will need to come to the hospital in the first place. The result for our hypothetical hospital is that it ends up with 800 discharges per quarter, and it has not budged its readmission rate! Officially, it has not improved, even though the work done by the hospital, by patients and families, and by community-based providers has improved care substantially, and has saved millions of dollars for Medicare. Yet, using the current flawed metric, the hospital is still likely to be penalized for having a high rate of readmissions!

This is not a new observation. The first sizable pilot project that CMS sponsored involved 14 communities, and the readmissions/discharges metric functioned so poorly that the outcome measure was changed during the project to a population-based measure: readmissions per 1,000 Medicare FFS beneficiaries in the geographic community [See: http://jama.jamanetwork.com/article.aspx?articleid=1558278]. That measure works to track changes in the experience of those living in a community, but it does not help in assigning credit or blame to particular providers (unless there is only one provider in the area). It is intrinsically community-anchored. The rub is that while good care of frail, chronically ill persons is at heart a community endeavor, Medicare has few tools to incentivize or penalize communities.

Furthermore, it is not clear what the “right rate” of readmissions should be. Very little work has been published on how well the various metrics perform in various circumstances, though NQF has a score of new ones under consideration [See: http://www.qualityforum.org/ProjectDescription.aspx?projectID=73619]. The hospital penalty measure has a very complicated risk adjustment, but should the population-based measure also be risk-adjusted (perhaps at least for the population age structure and whether the person is in Medicare due to disability or age)?

The problem here is more urgent than other controversies regarding the Medicare readmission measure such as higher readmission rates in disadvantaged populations and whether communities with low total hospital utilization should be expected to have higher readmission rates. In the case of measuring change, the measurement flaw directly punishes hospitals and communities for doing what the Affordable Care Act and the Medicare Readmissions Reduction Program otherwise encourage them to do: reduce preventable hospitalizations.

What should a responsible system manager like Medicare do? Below are some suggestions.

In the short-term:

  1. Quickly sort out how to exclude certain contexts, perhaps as part of risk adjustment – e.g., whether CMS is authorized to limit application of the readmissions/discharges metric through regulation, or whether the issue has to go back to Congress.
    1. For safety net hospitals – don’t penalize hospitals primarily serving poor beneficiaries.
    2. For reducing admissions – see which of these approaches works best (or combine them)
      1. Hospitals with declining admissions (and the same bed size), when the decline is at roughly the same rate (or more) than declining readmissions
      2. Hospitals with >50% of their Medicare FFS utilization in counties with admission rates in the lowest quartile in the nation
  2. Allow hospitals in a particular geographic area to propose accountability for a population – jointly or singly – so long as they together supply more than, for example, 70% of the hospital use for that population. Then measure their success on a population basis (readmissions/1,000 relevant people living in the area/quarter, and admissions/1,000/quarter)

In the longer-term:

  1. Develop useful metrics for continuity and quality of care, especially for:
    1. Reliability, patient/family sense of trustworthiness/preparation; and
    2. Patient/family driven care plans, evaluated for quality with feedback
  2. Develop useful metrics for the global costs of care, including private and Medicaid costs, for longer terms of illness, not depending upon hospitalization as the trigger, and including long-term services and supports.

What Can You Do Now?

If you agree, let’s talk about how to make improvements to the metric with the National Quality Forum, CMS, hospitals, and other interested organizations and colleagues. Feel free to add comments and suggestions here, too. Let’s build a commitment to evolving toward measures that really reflect optimal care, rather than staying with the under-performing and often misleading ones we have.

Want to know more?

Jencks et al.’s New England Journal of Medicine article on readmission statistics:
http://www.nejm.org/doi/full/10.1056/NEJMsa0803563

The Hospital Readmissions Reduction Program:
http://www.cms.gov/Medicare/Medicare-Fee-for-Service-Payment/AcuteInpatientPPS/Readmissions-Reduction-Program.html

The Community-based Care Transitions Program:
http://innovation.cms.gov/initiatives/CCTP/

twitterrssyoutube
Sep 282011
 

A three-part protocol, involving standardized assessment, palliative care consultations, and root cause analysis led to a 20% reduction in hospital readmissions for elderly skilled nursing facility residents, according to the AHRQ Health Care Innovations Exchange.

Led by Dr. Randi Berkowitz, a Practice Change Fellow, the initiative focused on reducing the risk of hospital readmissions at Hebrew SeniorLife,  an integrated eight-site system of health care, housing, research, and teaching based in Boston. The Practice Change Fellows Program [now the Practice Change Leaders for Aging and Health Program] is a two-year award that enables clinicians to work on projects to improve care of older adults, supporting them as they develop leadership skills and content expertise.

According to AHRQ, Berkowitz developed a program that featured: standardized assessment at admission to identify patients with multiple prior hospitalizations, palliative care consults and care plans for those who had had three or more hospitalizations in the previous six months, and a multidisciplinary staff conference to examine the root causes of inpatient readmissions when they occurred. As a result, inpatient readmissions decreased by 20%, from 16.5% before implementation to 13.3% after it.

Developing the project required that Berkowitz obtain approval from Hebrew SeniorLife leaders, form and advisory committee, develop the standardized admissions template, and introduce program and multidisciplinary conferences.  Learn more about the work at

http://www.ncbi.nlm.nih.gov/pubmed?term=Berkowitz%2C%20Randi%20American%20Geriatrics%20Society

Key Words: readmissions, palliative care consults, skilled nursing facility, care transitions

twitterrssyoutube