May 112022
 

This is an explanation of the Provider Network Analyses that the Colorado Foundation for Medical Care Analytic Services team created for the communities participating in the Using Data to Drive Improvement/Supporting Data and Communities Special Innovation Project.

As used on this web site, Provider Network Analysis (PNA) characterizes relationships among healthcare service providers in a network and enables the user to visualize the network as a diagram of interconnected nodes. PNA is a specialized example of a more general methodology called Social Network Analysis (SNA), and you may find that term used in some documentation on this web site when discussing PNA. Applied to the parties-to-transition table (PTT) from the Integrating Care for Populations and Communities Aim, PNA can inform intervention strategies by identifying the sender-receiver relationships that account for a large proportion of the community’s transitions.

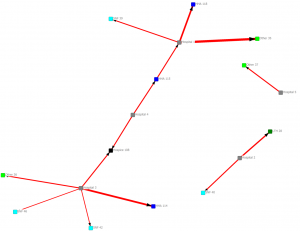
Care transitions network diagrams depict the flow of transitions among providers in the community. Providers are shown as colored nodes, with a unique color for each provider type (e.g., Hospital, SNF, HHA). Transitions between providers are represented by an arrow connecting the two nodes. Unidirectional ties – where transitions flow only from sender to receiver – are depicted as black, single-headed arrows. Bidirectional ties – where transitions flow in both directions between providers – are depicted as red, double-headed arrows. The size and weight of the arrow indicate the tie’s relative strength: thicker arrows represent more transitions, and larger arrowheads represent higher flow in the direction indicated. The relative distance between providers is not intended to depict any specific aspect of their relationship. The position of the provider nodes is not based on geography. Node placement is determined by the “closeness” of providers measured by their frequency of interaction with one another.

Provider Network Analysis Example

Presented below is one product of PNA: the network diagram. This example is based on the Monroe, Louisiana, Hospital Referral Region Provider Network Analysis.

Provider Network Analysis of Monroe HRR

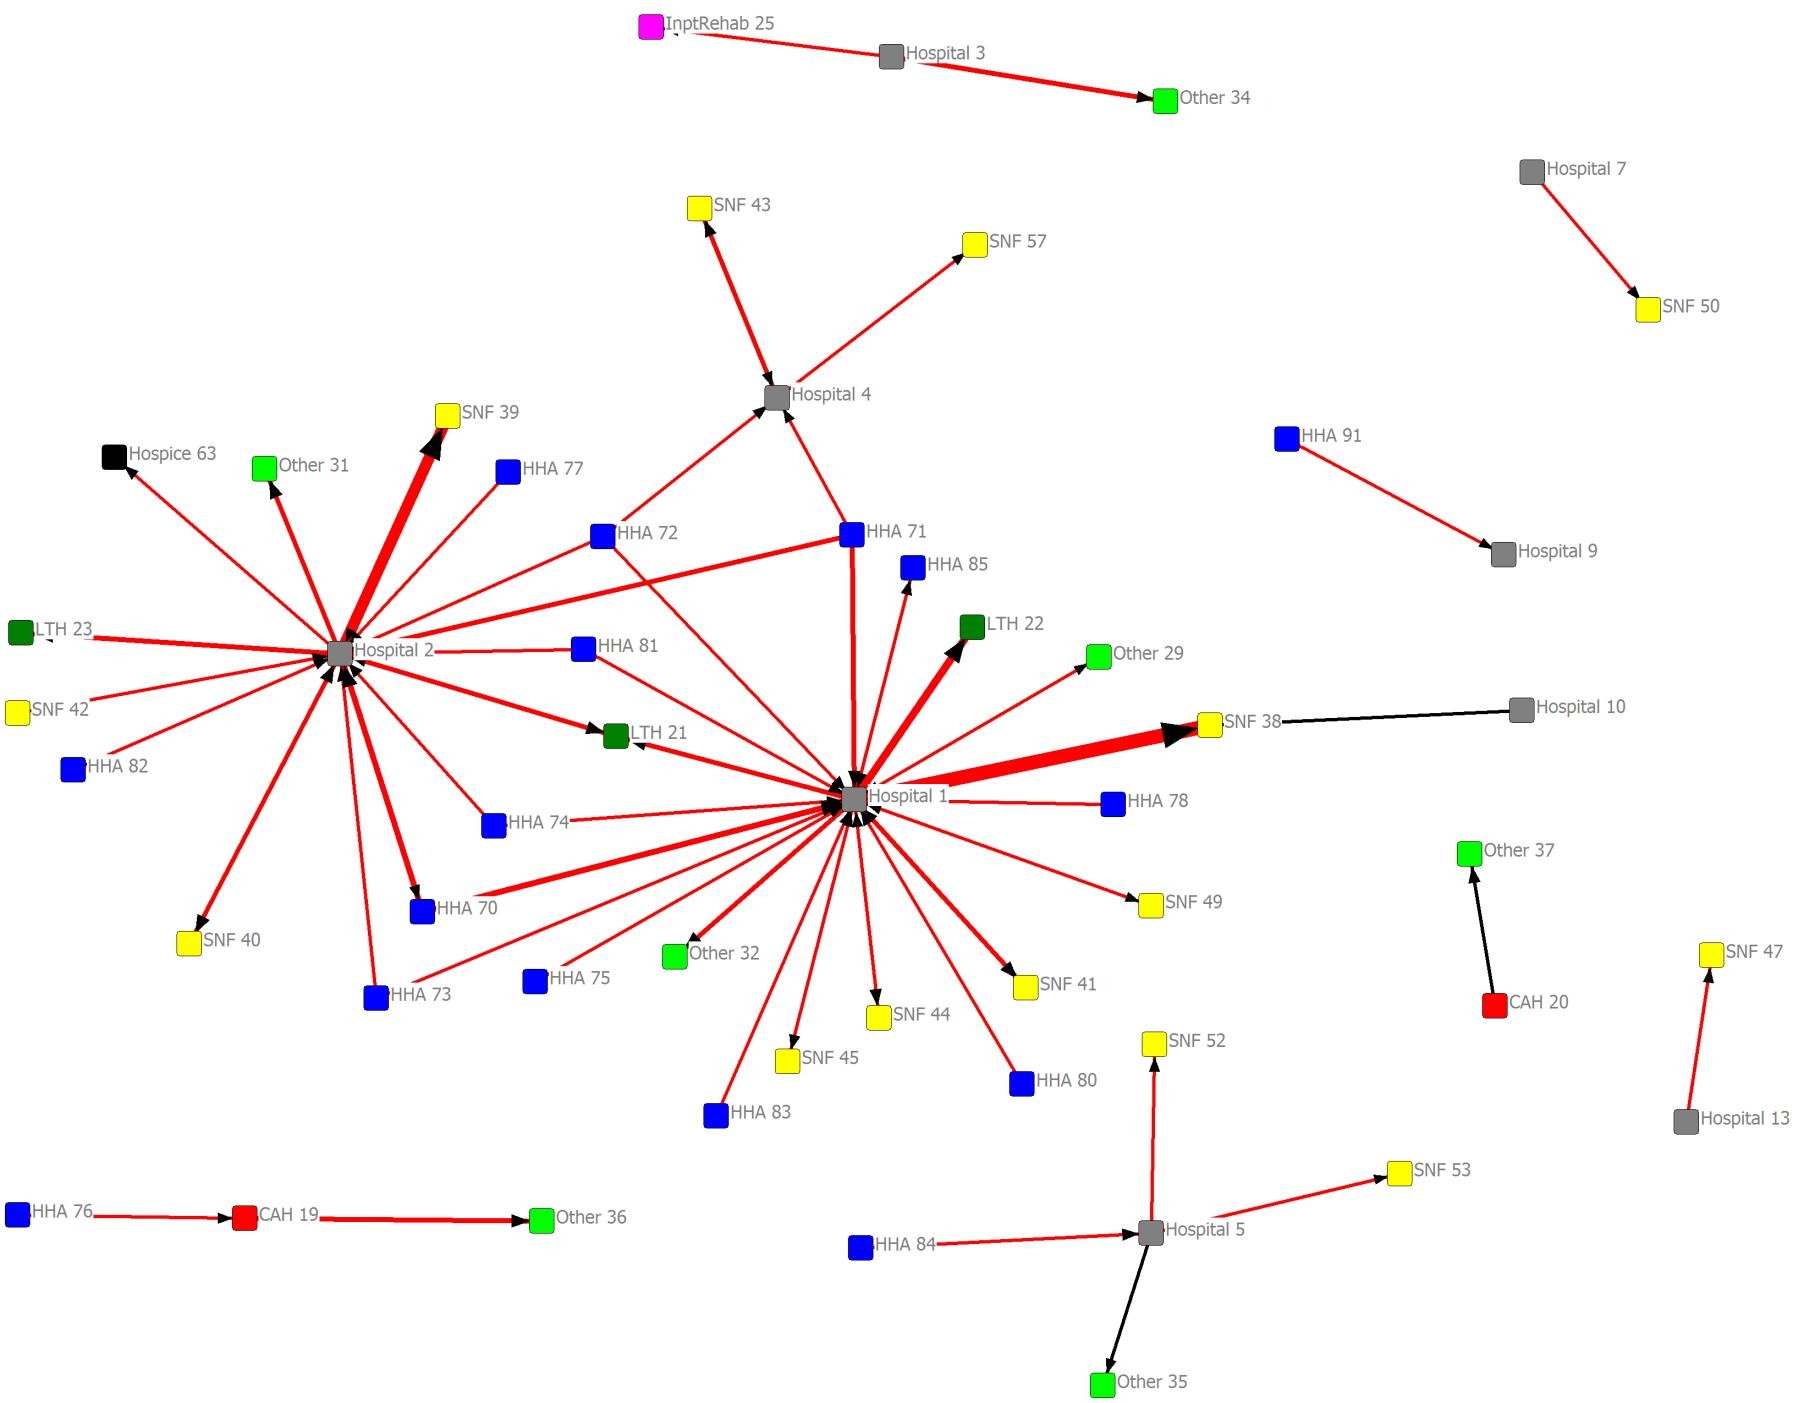
Monroe, Louisiana Hospital Referral Region Provider Network Analysis

The visual conventions used in the diagrams are presented in the picture below.

Example of Provider Network Analysis

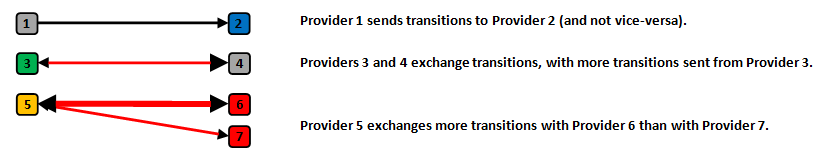
Coding of Provider Network Analysis

The diagrams were derived from the PTT for the community of interest, depicting fee-for-service Medicare Part A (non-outpatient) claims during the calendar year 2011. Each diagram is filtered by a threshold number of transitions shared.

Filtering of ties by number of transitions may result in red, single-headed arrows, which indicates the threshold number of transitions being met only in the direction of the arrowhead. When the threshold of shared transitions is met in total, but not in either single direction, the tie will be red with no arrowheads.

Some things to look for

  • Thick, red arrows (especially if one node is a hospital; high back-and-forth flow suggests high readmissions associated with the downstream provider)
  • Hub and spoke patterns (often a hospital and its prominent downstream providers)
  • Several arrows pointing to a single node (leverage point for receiver intervention)
  • To enable sharing of the network diagrams among community stakeholders, provider identifiers have been replaced with an alias referencing provider type (e.g., “Hospital 1”). For Medicare provider numbers (hsp_id), the analyst should refer to the community’s provider identifier list. Moreover, the actual numbers of transitions shared among providers during this time period, which determines the thickness of the arrow, may also be useful.

Provider Network Analysis Filtering Example

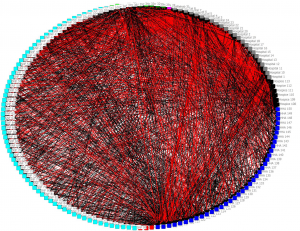
Provider Network Analysis diagrams can be very confusing if many relationships are shown at once. To make major parts of the network more clear, simpler versions of the diagrams can be shown. By increasing the number of interactions required to show a relationship, the number of qualifying relationships will be reduced. This produces diagrams that show fewer connections.

Here is an example of a very complex diagram that conveys little information:

All providers for Cincinnati (CY 2011). Connections indicate one or more transitions shared.

Cincinnati provider network analysis, one or more transition filter, 2011.

All providers for Cincinnati (CY 2011). Connections indicate one or more transitions shared.

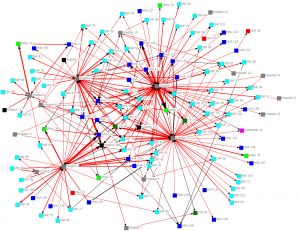
In the next diagram we only show connections with 10 or more interactions:

Providers connected by a minimum of 10 transitions (CY 2011)

10 or more transitions filter on a 2011 Cincinnati provider network analysis

Providers connected by a minimum of 10 transitions (CY 2011)

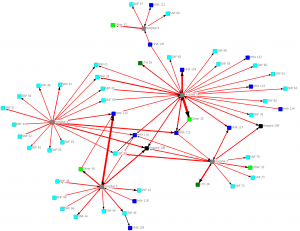
In the next diagram we only show connections with 30 or more interactions:

Providers connected by a minimum of 30 transitions (CY 2011)

30 or more transitions filter on a 2011 Cincinnati provider network analysis

Providers connected by a minimum of 30 transitions (CY 2011)

In the next diagram we only show connections with 100 or more interactions:

Providers connected by a minimum of 100 transitions (CY 2011)

100 or more transitions filter on a 2011 Cincinnati provider network analysis.

Providers connected by a minimum of 10 transitions (CY 2011)

Source material

Introduction to Social Network Methods (Hanneman & Riddle, 2005; This is an explanation of the Provider Network Analyses that the Colorado Foundation for Medical Care Analytic Services team created for the communities participating in the Using Data to Drive Improvement/Supporting Data and Communities Special Innovation Project.
http://faculty.ucr.edu/~hanneman/nettext/)

UCINET documentation (Borgatti, Everett & Freeman, 2002; http://www.analytictech.com/ucinet/)

Acknowledgements: Qualis Health, Colorado Foundation for Medical Care

twitterrssyoutube
Feb 272019
 
Combined portrait of Anne Montgomery & Sarah Slocum
Anne and Sarah

For an enterprise that sometimes seems beleaguered, culture change in nursing homes is a bright spot of positive, forward-looking movement and quality improvement. Yet widespread implementation of culture change – anchored in comprehensive staff training in person-centered care — has not yet happened. Part of the reason is that the specific gains that culture change can achieve have not been sufficiently well characterized to be readily replicable, scalable and sustainable.

A three-year initiative [see press release] that Altarum’s Program to Improve Eldercare began in January will strive to change this. Funded by the Michigan Department of Health and Human Services, the project is designed to test, implement and evaluate two phases of comprehensive, person-centered training provided by The Eden Alternative in six Michigan nursing homes. The homes – Beacon Hill at Eastgate, Metron of Forest Hills, Metron of Big Rapids, Spectrum Health Rehabilitation and Nursing Centers-United and Kelsey, and the Martha T. Berry Medical Care Facility — will be working throughout the project to make concrete changes in a range of operational protocols and practices.

Altarum will evaluate what residents, families, and staff report about their quality of life and their living/working environments; assess changes in selected clinical quality metrics; and analyze the economic impact of culture change on participating homes.  We will track clinical quality metrics throughout the project using quarterly Minimum Data Set (MDS) information about pain, depression, and utilization of antipsychotics. The impact on hospitalizations will also be tracked.

To assess economic impact, Altarum will examine information on operational costs, capital investments, occupancy and staffing. To measure the possible impact of culture change on staffing, we will use data from the Payroll-Based Journal (PBJ), together with a consistent methodology for calculating staff turnover. An Altarum-designed “Systems Change Tracking Tool” (SCTT) will capture on-the-ground changes that nursing home leadership, working in conjunction with clinical and non-clinical staff, elect to make over time. For example, the SCTT asks staff to provide information about whether:

  • The home honors CNAs as key decision-makers in helping to prioritize and implement changes that aim to improve care and quality of life for residents;
  • The home’s overall physical environment fosters feelings of belonging and comfort;
  • Residents have easy, safe access to a garden/patio/outdoor space (i.e. doors are unlocked and residents are easily able to maneuver through doors, or team members are readily available to accompany and assist them);
  • Residents are engaged in determining menu selections;
  • Residents are offered alternative non-pharmacological therapies, treatments and modalities (e.g., music therapy, stress reduction techniques) and staff are trained in how to carry them out.

The six homes participating in this project are highly motivated and self-selected; they do not have “perfect” scores on Nursing Home Compare. They have enthusiastically agreed to participate in the hope that the Eden Alternative training and the careful, consistent monitoring and feedback that they will receive from Eden and Altarum over the three-year period will result in sustainable, improved quality of life for residents; more rewarding, relationship-focused work environments for staff; equivalent or higher scores in the three clinical quality metrics; equivalent or lower hospital readmissions; and solid economic indicators showing that culture change makes the homes a more desired residence in their market.

At Altarum, we look forward to seeing what unfolds and recording it all in an evaluation, while establishing what we hope will be a good roadmap that many other homes can choose to follow. We think that culture change offers excellent opportunities for individuals with disabilities to live well in an environment that removes any sense that one is living in a somewhat deficient hospital — and instead is living in a home that is comfortable, comforting, attuned to one’s needs and preferences, and that also delivers consistently good medical and supportive care.

A quick PowerPoint overview of the project, “Culture Change in Nursing Homes: Accelerating Quality Improvement for Long-Stay Residents in Michigan,” is available for download here.

twitterrssyoutube
Jun 182018
 

The Program to Improve Eldercare (PIE) at Altarum Institute is preparing to award several small contracts to healthcare organizations, Public Health Departments, Area Agencies on Aging, and community-based organizations (CBOs) to carry out guided planning efforts to improve care for frail elders though more effective use of existing data concerning persons living in their catchment areas. The overall goal is to help local management define and generate measures of the local system’s performance concerning eldercare.

The contracts will not require collecting any new data. Each site will work with their own data that is already on hand to conduct aggregated analyses for their own community and region. The results of all funded contracts will form the basis for a national White Paper on how communities across the United States can monitor and manage the arrangements for care for elders living with disabilities and chronic conditions through improved use of aggregated data from multiple sources, such as clinical care, surveys, and use of community services.

Our goal is to empower communities and therefore to fund pilot projects that show high promise using several different approaches to community management of eldercare. Throughout, we aim to work with the sites to identify and document business models in use at the partner sites to support existing or improved system performance for providing adequate supportive care services.

This effort is funded by the Gordon and Betty Moore Foundation through Grant GBMF5662 to Altarum Institute (“Aggregating Care Plans to Manage Supportive Care Services for Elders”), Joanne Lynn, M.D., Principal Investigator.

We invite organizations to contact us to discuss this in order to determine their interest in participating. Please contact us via email to [email protected]. We will be happy to help you determine if your community would be a suitable candidate for these projects.

Contracts will be awarded in two phases.

  1. Site Readiness Assessment Contracts (Performed from July 2018 through November 2018)
  2. Site Pilot Implementation Contracts (to be completed by June 2019)

Site Readiness Assessment Contracts (Performed from July 2018 through November 2018)

  • The Readiness Assessment contract phase will select up to ten geographically-focused organizations (“sites”) to receive a contract of $10,000 to participate in a structured strategic planning process to help the sites evaluate their current uses of data related to service provision for elders in their geographic region. We are looking for sites that at least begin to represent a geographic community’s population and that include at least some attention to both social supports and medical care. We are interested in entire catchment areas as a service delivery setting. With assistance from our national program staff, the sites will prepare a Readiness Assessment and strategic plan for improving quality and reducing cost for their eldercare system through better use of data and management information systems.
  • Our national staff will work with each of the sites to prepare a customized project plan that works backward from the seven strategic planning outputs we are studying for each site. The list of outputs in seven study domains is summarized in Appendix A, below. At the end of the planning process, each site will receive a Readiness Assessment report that will form the basis of our selection process for the next round of contracts, which will provide limited funding toward some costs of actual implementations in some sites.

Site Pilot Implementation Contracts (to be completed by June 2019)

  • This phase will award Pilot Implementation contracts at up to six sites to carry out pilot projects based on their Readiness Assessment results. The amount of the Pilot Implementation Contracts will vary depending on the projects proposed by the sites, but we expect that the minimum awards will be approximately $30,000 per site. Some sites may receive larger awards if their plans are complex. As with the Readiness Assessment contracts, our national staff will provide advisory assistance, but actual work will be done by the sites themselves to ensure that an ongoing capability is built locally in a sustainable manner. The Pilot Implementation contracts will probably not cover all implementation costs for every project. Local participation will be needed to ensure the pilot has some chance of being sustainable.
  • If, at the end of the Pilot Implementation, a site has built a working data flow environment and demonstration management information system and has shown that the analytics coming from it are of actionable value to decisionmakers, our national staff will explore with them ways to seek continuation funding to help them transition the pilot system to an ongoing management reporting system. Continuation funding is not guaranteed as part of this effort, so finding ways to create sustainable business models is an important part of the process.

How to apply to partner in this work

To apply, send Email to [email protected] AND [email protected] with the following information:

  • Subject line – “Community Eldercare Metrics, Planning”
  • State the contact email(s) and phone number(s) of the person or team applying.
  • Define the community you aim to serve.
  • Briefly explain your vision, governance, and data available to the project.
  • Send it soon! We will follow up with the more promising teams on a rolling basis and aim to have all teams identified within July 2018 and to have plans and contracts within August and September 2018, depending upon labor availability at the sites and in our staff.

Appendix A: Overview of Site Readiness Assessment Domains

The site Readiness Assessment planning process will provide sites with a $10,000 contract to work with our national staff to explore seven key domains that are essential to creation of an effective management reporting system for community eldercare. We do not expect that all sites will have advanced information technology capabilities in place. Information for this process is expected to be collected primarily by videoconferencing, with little or no travel expenditures for site personnel. The questions listed in this table will be explored during the Readiness Assessment contract period, and need not be answered as part of a contract application.

You may download a PDF file with details on the seven Site Readiness Assessment Domains.

You may download a PowerPoint presentation with further details on the process for Site Readiness Assessments and information on how to apply.

twitterrssyoutube
Mar 282018
 

By Les Morgan

The following reports were produced as deliverables for our project “Aggregating Care Plans to Manage Supportive Care Services for Elders” (Joanne Lynn, M.D., Principal Investigator).This project is funded by the Gordon and Betty Moore Foundation through Grant GBMF5662 to Altarum Institute. Dr. Lynn will provide a more detailed report on the project as a whole in a following blog post.

We are releasing these reports now particularly to help some of the community groups we are working with on data projects. The first three reports cover technical details of how care plans can be structured, stored, and shared in electronic information systems. Those three reports taken together provide useful information that can be used by community groups seeking insight into eldercare through the use of data aggregation methods.

Communities that are seeking to improve eldercare need trustworthy data to use in setting priorities and in monitoring improvements. One appealing approach is to aggregate existing health-related records and analyze the data for key indicators of how their local system is functioning. However, for most of the communities we have worked with, on a practical level the aggregation of this sort of data seems to be very difficult or impossible, given important concerns over privacy and the serious penalties associated with breaches of privacy obligations. Our hope is that these reports will help overcome some of the obstacles that stand in the way of improving care for some of our most vulnerable citizens.

To read the full reports in PDF format, click on the report name you wish to view.

Report 1

Interim Report on the Variety and Merits of Care Plan Templates and Regulations in Use, Including Implications for Information Technology [PDF]

Joanne Lynn and Les Morgan. October 20, 2017

Effective multidisciplinary clinical teams know their patients but document only a skeletal summary of the case. That summary generally includes diagnoses, basics of the living situation, medications, treatments, and supportive services in use or recommended. The various biases, omissions, and lack of long-term perspectives in the clinical documentation are substantial, as summarized in the report.

Our scan of forms and data formats for care plan documentation shows a wide variety of approaches. All made heavy use of free-text narrative elements. The most complete and up-to-date set of care plan records that we have seen was done longhand on a typewritten sheet by a single care coordinator responsible for over one hundred high-need patients seen at one hospital.

The electronic record systems that we reviewed used only to carry the minimal information needed for a C-CDA transmission mostly limited to immediate and near-term needs. None of the electronic records we examined were being used to record the caregivers with their roles, the prognosis, or an advance directive. None used the existing FHIR data format standards for complete care plans.

Report 2

Interim Report Summarizing Data Aggregation Methods in Use To Date and Their Strengths and Weaknesses [PDF]

Les Morgan. October 20, 2017

This is a high-level Information Technology (IT) architectural review discussing major variations in system design approaches for care plan data aggregation, based on a content analysis of interviews with vendors and some key users. A series of architectural diagrams is included to classify approaches. Our interviews with technology vendors are ongoing, and this preliminary summary of methods will evolve as we see more examples of working systems.

Report 3

Aggregating Patient-Level Data: Regulatory, Ethical, and Privacy Issues for Communities [PDF]

Les Morgan and Joanne Lynn. March 2018

This report gives an overview and assessment of regulatory, ethical, and privacy issues specifically related to the use of aggregated care plan and related health data for analytical use across defined geographical catchment areas. The literature covering regulation and privacy of healthcare data is extensive and often contentious. Our review here highlights some major sources for authoritative guidance, then moves on to the specific situation of using aggregated and de-identified data sets for geographic analysis. Regulations that are specific to requirements for maintaining care plans were covered in our prior project report (Interim Report on the Variety and Merits of Care Plan Templates and Regulations in Use, Including Implications for Information Technology) and are not repeated in this report.

A key conclusion of our review is that using aggregated and de-identified data on a broad geographic basis is probably not restricted as much as many of our community stakeholders and leaders think. Some uses of such data are specifically exempted from key privacy laws when appropriate protections are in place. Some regional health care payer systems and Health Information Exchanges (HIEs) have mechanisms to enable such research now, using very large data sets they have already compiled. This means that it is feasible to carry out pilot projects to demonstrate practical methods for data aggregation and analysis for a community or region in many parts of the United States.

Report 4

Benchmarking the Eldercare Workforce: A Community Focus [PDF]

Meghan Hendricksen and Joanne Lynn. February 2018

The overall purpose of this report is to provide an initial, alpha-version, benchmark of the workforce within geographic communities to use for illuminating comparisons with their own workforce estimates.

This baseline benchmark will provide a tool for consideration, and then feedback for improving the tool. In essence, we are creating the start of a learning system for optimizing the workforce in a geographic community. Once the estimates and ranges become substantiated in multiple communities and improvement activities, the maturing benchmarks will provide a trustworthy source of guidance for communities, where evidence is currently lacking, on what the priority needs are for the workforce that is serving older adults living in the community and also will provide a tool for monitoring improvements. Measuring the local workforce capacity also helps engaged community leaders to envision their whole system and its products, even though that “system” is owned and operated by many different entities that are not necessarily coordinated.

twitterrssyoutube
Mar 012017
 
Portrait of Dr. Joanne Lynn
Joanne Lynn, MD

By Joanne Lynn

Most of us now reading this will get the extraordinary privilege of being able to live into old age. For nearly all of human history, few people lived to be old, and even fewer lived long with serious disabilities. Now, most of us will have a substantial period of increasing disability at the end of long lives. The experience of people with serious illnesses and disabilities in old age (“frail elders”) and the experience of caregiving for an elderly person are profoundly shaped by the availability of supportive resources and appropriate medical care in the local community.

For example, some communities have ready availability of services such as home-delivered meals and wheelchair-adapted housing, while others have exceedingly long waiting lists for often-inadequate services. Some communities have developed substantial geriatric medical care, including house calls and telemedicine, while others rely on the hospital for every complication. Little is known about the experiences of elders and their caregivers in the usual community, since very little is captured about the community’s experience of this part of life in conventional surveys and reports. Many health systems and communities like to take on the responsibility of monitoring and improving the care system for disabled elders and their caregivers, rather than just offering rescue services for serious and often preventable complications; but they find that the reliable metrics needed to guide improvement are unavailable.

We’ve given some thought to potential ways to meet these needs, and here’s what seems possible and affordable in order to make a measurement dashboard to guide improving a community’s eldercare system. First, one could mine large existing databases, such as Medicare and Medicaid claims, Outcome and Assessment Information Set (OASIS) home health agency assessments, and Minimum Data Set (MDS) nursing home assessments. Then, one could monitor demand for and performance of key service providers, such as wait lists for home-delivered meals or availability of wheelchair-adapted housing. Third, the community could interview family and caregivers for a sample of elderly decedents and describe the experience of the last couple of years. This strategy would sample those who received few services and demanded little, and it would allow exploration of critical issues such as bankrupting elders and families and providing culturally appropriate services.

Our last data source, learning by aggregating care plans, is a bit beyond current implementation, but it could enable the opportunity for substantial monitoring and improvement efforts. We envision having records with the key elements of service needs for nearly all frail and disabled elders in a geographic area. Being able to combine them electronically would yield rich data in order to summarize needs, services provided, gaps, oversupply, and quality problems—both for the whole community and by mapping to clarify the locus of some issues. If, for example, the community has 500 elderly people so disabled that they should have medical care at home, and the community had current capacity only for 100, then one could identify and map the areas of need and examine the current and potential supply options to address the gaps. Furthermore, with data on demand and supply for a dozen important service needs, the community would be able to set priorities for investments in public resources. You can read more about how this kind of community management would work in our book.

Of course this work requires adequate care plans, preferably in a format that allows electronic identification of the plan and its elements. At present, too few elders living with advanced illnesses have reasonably comprehensive care plans created, and even fewer have them written down, even in narrative form. We’ve also realized that shortages of, or quality shortcomings with, important services are addressed explicitly or noted in the record. Thus, a person who really would do better with door-to-door wheelchair transportation and lives in a community lacking this service will instead have the substitute arrangements in his care plan, such as “transportation relies on the availability of his son-in-law Tom, so appointments need to revolve around Tom’s availability.” The shortage of appropriate transportation options might be inferred but is not likely to be explicitly stated. Similarly, the lack of respite for a caregiver will not be noted. Therefore, additional work is needed to develop comprehensive care planning, which includes collaboration with the regulatory and technical bodies that are working on the standards for care planning.

With funding from the Gordon and Betty Moore Foundation, we are working to develop the methodology to do care plan aggregation. We are actively seeking communities that would like to help us develop these methods by letting us try it out with their population. We want to know what information from care plans you think would be most relevant and how you’d want to act on that knowledge, what entity in your community might be able and willing to act, and whether it is worthwhile to push for better and more standardized care plans.

Please email us at [email protected] if you know of or belong to an organization that might be able to work with us.

twitterrssyoutube
Sep 282015
 

By Joanne Lynn, MD

If you are hoping for a good night’s sleep, don’t read the stories told by Marcy Cottrell Houle of her parents’ last years of life just before you go to bed. But do read The Gift of Caring: Saving Our Parents from the Perils of Modern Healthcare [http://www.thegiftofcaring.net/], which Houle wrote with geriatrician Elizabeth Eckstrom over a cup of coffee. That will get you fired up. The litany of catastrophes that occur in our poorly organized medical care system—preventable, avoidable suffering—is overwhelming. So far, though, no one is listening. No one is reacting in horror, and no one is changing the system to stop these errors. We need to turn up the volume of our protests!

Marcy’s father was once abruptly discharged from the hospital to a nursing home that lost him! The nursing home put him in a room at the end of a hall and simply forgot he was there! No hygiene, no food—nothing was provided for him. In fact, the staff forgot to give him water for so long that he developed renal failure. He was later drugged to manage his behavior, which was eventually traced to pain, readily treated with acetaminophen. His case spiraled on and on.

Marcy’s mother had all the geriatric complications: delirium, falls, anti-coagulation, terrible aides. Worse still were her run-ins with physicians who wouldn’t pause to make sense of sudden changes in mental status, because they just assigned every dysfunction to “old age” and “dementia,” even when her mother had been functioning quite well just a day before.

Yes, it’s all there, terrible and terrifying. Dr. Eckstrom writes a chapter after every calamity about how patients and families might prevent or cope better. The book is a rare gem to help people who must navigate our “care system” for frail older people.

But it is maddening.

If you bought a toy that fell apart in a dangerous way, you could report it to the U.S. Consumer Product Safety Commission, and they’d investigate. If a person has a near miss from a safety defect in a car, the National Highway Traffic Safety Administration wants to hear about it immediately. If a medication causes a serious side effect, the Food and Drug Administration has a consumer online reporting form. Indeed, any of these and more pop up when I search online. But just try reporting that your dad was lost in a nursing home. You have to be knowledgeable enough to find the ombudsman program or the Quality Improvement Network or know a lawyer willing to threaten to sue in order to call attention to a grave mistake.

The problems in care of the elderly are not just “errors” in the usual sense of unusual mistakes. In fact, they are baked right into our current delivery system. The errors are not just a nurse or aide slipping up on some critical step. Instead, all the nurses and aides and everyone else are working in a system that is so dysfunctional that actions that cause pain or neglect are not even called out as errors. Consider that I can go up to an ATM in the remote wilderness somewhere in the world, and the banking system will know whether I have money in my account; but if I am discharged from the hospital, my community physician won’t know anything about what happened to me in the hospital, often even if she’s been my physician for years and I told the hospital folks this.

Think about the profound errors that are made when medical professionals simply have no idea what matters to patients and their loved ones. They never ask! For example, consider two men living with the same advanced degree of disability from Parkinson’s disease. One might want to spend anything and do whatever is necessary in order to survive long enough to finish a personal project, while the other might really want not to leave his spouse impoverished. The second man might feel at peace with the fact that life is coming to its end and even to feel OK with letting it end a bit early in order to have things fall into place for those he loves.

Today, emergency room staff do not know any of this because of the way in which we have put this system together. Both these men experiencing a sudden deterioration, however, would have to use the emergency room, because we don’t have 24/7 on-call physicians organized to come to their homes. We don’t even have home-delivered meals for many elderly persons in need in most of the country; the waiting lists are routinely more than 6 months long, because we have not chosen to fund the Older Americans Act adequately.

What are we doing? And how can we complain effectively? Each family somehow believes that its situation is bad luck or “how things are.” There is no benchmark by which to set expectations, so the families accept the errors, dysfunctions, suffering, and impoverishment that so often come with disabilities in old age. Why are the errors of our system not being debated or even mentioned in political campaigns? How can we change this?

We can start by changing our abysmal expectations of the services that we get. Let’s question why the care system is so deaf to the priorities of our loved ones everywhere we can—in the newspapers, in the candidate debates, through social media. Let’s reengineer current services, build highly reliable care systems in our communities, and see what it really costs. Projections for the costs of a community-anchored care system that is person centered and flexible enough to bring most services into the home are not much different from current care arrangements. Let’s record stories, good and bad. Let’s figure out how family caregivers can become politically powerful. Why is it, for example, that Medicare has no standing advisory committee speaking for the interests of its millions of beneficiaries? If we are lucky, we will grow old. So it’s our future, too, not just our parents’!

We’ve started an initiative to get family caregiver issues on the party platforms in all states that generate party platforms. You can join the Family Caregiver Platform Project initiative. It takes very little time and gets leaders talking. Go to http://caregivercorps.org to sign up now.

There are some bright spots on which we can build: The Centers for Medicare & Medicaid Services has introduced payment for advanced care planning discussions between Medicare beneficiaries and their physicians. We agree that this is a good idea and strongly support it. But care planning is not just an end-of-life matter; it needs to be comprehensive and a standard practice. All health care providers and social services agencies should pursue the goals that the elder and family actually most want.

What else can you think of? We need other leverage points that would focus the pent-up frustration of millions of family members who have already witnessed the misery of ordinary elder care. What should have been available to Marcy as she helped her parents live their last years? Hers is a story that we can all absorb and tell others; then we can go out and insist that our care system change. Eventually, Marcy and her family found some exceptional paid caregivers, and together they achieved some good experiences, even triumphs. But this came after needless suffering. She would say that she’s lucky, and others would say that she’s especially skilled and capable. Most of us need a care system that does not require exceptionally skilled and capable family members or good luck. Read her book, and help us push for a care system that works reliably for our old age!

twitterrssyoutube
Feb 252015
 

By Joanne Lynn

In late January, Department of Health and Human Services Secretary Sylvia Matthews Burwell announced that Medicare would purchase most services on the basis of value rather than volume, aiming for 90% of fee-for-service payments by 2018 [http://www.hhs.gov/blog/2015/01/26/progress-towards-better-care-smarter-spending-healthier-people.html]. Of course, paying on the basis of value is much better than paying on the basis of volume. But a moment’s reflection shows that this strategy requires figuring out what people value. For a child with a broken arm or a middle-aged woman with a gall-bladder attack, desirable outcomes are obvious, widely agreed upon, and readily measured. But this is just not the case for frail elders.

Consider a new heart attack affecting a 94-year-old living with multiple chronic conditions, self-care disability, and a lifetime of experiences and relationships. Different 94-year-olds will value very different things when it comes to treatment characteristics and quality-of-life goals; for example, some will desperately want not to go to the hospital, even if doing so would likely extend their lives, and others will welcome hospitalization with intensive care and every opportunity to get back to the way things were.

Even well-established quality metrics that are important to elder care, including avoiding delirium or the degree to which the person’s symptoms are addressed, are not yet used by Medicare, and the program has done little to develop ways to identify excellent care for frail elders. Rates of certain calamities and medical errors are currently measured, but elderly persons and their families expect that more will be monitored than mere safety. When we are old and frail and facing death, we need the quality of our care to be measured by whether it offers an opportunity to attend to important relationships, live comfortably, and pursue what matters most to each of us. Generic measures that reflect what someone else values won’t suffice.

Consider first what Medicare has set up as measures for this population. A starkly disturbing insight arises in the list of measures under consideration for implementing the Improving Medicare Post‐Acute Care Transformation (IMPACT) Act that are meant to measure outcomes and quality in after-hospital care. [List of Ad Hoc Measures under Consideration for the Improving Medicare Post‐Acute Care Transformation (IMPACT) Act of 2014, http://www.qualityforum.org/WorkArea/linkit.aspx?LinkIdentifier=id&ItemID=78784.] Given the short timeline, the Centers for Medicare and Medicaid Services (CMS) has proposed measures that have already been approved or that are in the process of approval. CMS proposes four measures, each applied in four care settings: the rate of pressure ulcers, the rate of falls with injury, the existence of functional assessment and whether there is a care plan with a goal that involves function, and readmissions.

But in setting out to talk with frail, elderly people leaving the hospital for a short-term stay in a nursing home before they go home, what do we imagine are their highest priorities? The four that Medicare proposes might make the list, except that the way we measure readmissions is seriously deficient, even with risk adjustment [ https://medicaring.org/2014/12/16/protecting-hospitals/; https://medicaring.org/2014/12/08/lynn-evidence/ ]. But most people have other priorities that are equally or more important, such as whether there is a workable plan to get the daily care and support needed (e.g., housing modifications, food, transportation, and personal care). Another question elders often ask is what the effects of their disabilities on the family will be, especially if family members have to provide more care. Elders may also want to be sure that they will have the symptom (pain) control, spiritual support, and reliable supportive care that they will need as their conditions get worse, whether they are in a care system that will maximally preserve their financial assets so that they have a lower risk of running out, and whether they will have to move to a nursing home. Medicare’s metrics don’t yet even try to address these concerns.

Even more troubling is the fact that Medicare does not yet have any methods to judge the match between the services given and the patient’s perspective as to what matters. Current metrics are all grounded in professional standards, and professionals have been slow to build standards that truly take into account the very different things that individuals want in late life. A high-quality service delivery system must try to match the priority needs and preferences of each elder.

As Medicare moves toward paying its providers on the basis of value, it is important to keep in mind what you value is often not what I value, and this difference becomes more pronounced as we have to live with physical and financial limitations and the increasing proximity of death. Here are some steps that we can take:

  • We should demand that Medicare invest in developing measures that matter for the frail phase of life before distorting the delivery system with incentives applying to everyone (e.g., to avoid pressure ulcers, falls, and readmissions) and to have and achieve goals concerning function.
  • CMS should be willing to be the “measures steward” or should fund another entity to do so, since the money available for frail elder care does not spin off strong organizations that can do the developmental work and then maintain updated measures.
  • Our health information systems (e.g., in Meaningful Use Stage 3) should at least start making room in medical records to document each patient’s priorities and the care plan that is supposed to reflect those priorities.

Buying on value is the right idea, but buying value for each elder requires knowing what each one values.

twitterrssyoutube
Dec 222014
 

By Elizabeth Rolf

Take a look at the Swedish national dashboard for eldercare. It’s a great model. An analytics approach that works, Senior Alert (http://plus.lj.se/senioralert) takes the preventive care of every individual patient and inputs the data outcomes in a quality dashboard for each municipality, accessible to doctors, patients, and the public. The civic leader or ordinary citizen can see how their municipality is doing in reducing pressure ulcers or antipsychotic use, and how many patients who need a preventive intervention have had it done. An interactive data system like this is an aspiration for many in the United States, but in Sweden, it is a wonderful reality. Earlier this month, Goran Hendriks, Susanne Lundblad, and Dennis Nordvall presented Sweden’s action plan to an audience in a webinar, which is available online. Many were able to see the results that this remarkable, comprehensive dashboard provides to guide improvement in preventive care by tracking data concerning the risks of falls, pressure ulcers, malnutrition, poor oral health, and incontinence. The information gained in a systematic way is often useful to understand how to treat the problem areas for each elderly patient as an individual, but the exciting application is the guidance it provides for shaping the care system for the entire elderly population of a particular municipality or country.

Lilly, age 95, provides the example used to demonstrate Senior Alert. Her story centers on declining health, increasing disability, and need of reliable care process. The registry that monitors her condition and services helps ensure comprehensive care. By registering Lilly for Senior Alert, her doctor, her family and she are assured that she will have a risk assessment by a team of professionals who will recommend and implement preventive interventions, evaluate these interventions and adjust accordingly.

The data system combines Lilly’s data with all from her geo-political area and provides up-to-date and interactive information as to the progress of each municipality and county with regard to excellent preventive service for fragile elderly persons.

Senior Alert was implemented in 2010, and in the last four years, all 21 counties in Sweden use the program and 288 of 290 municipalities are involved as well. In addition to public programs, 129 private health care providers use Senior Alert. In this time, patients are receiving personalized care plans, along with fewer risks to the patients because of the attention to the needs of each patient. As the process is followed, both the patient and the doctor can see improved results, and these results can be viewed publically online. The data collected can be used to track prevention progress daily for individual patients in many different categories, but collectively creating a reliable care process for Sweden’s entire elderly population. All results keep the patient confidential of course, but the public can access results of various actions.

Want to know more?

Link to Senior Alert: http://plus.lj.se/senioralert

twitterrssyoutube
Dec 162014
 

by Stephen F. Jencks, M.D., M.P.H.

[Also see companion post by Joanne Lynn, M.D.]

Issue.

The Medicare Readmission Reduction Program (MRRP) encourages hospitals to reduce readmissions within 30 days of discharge by imposing substantial financial penalties on hospitals with more readmissions than would be expected if the same patients were discharged from an average hospital.[1] But some hospitals and communities have succeeded too well and reduced discharges even more than readmissions so that their readmission rates, as currently calculated, do not improve much, which puts them at higher risk for penalties. There are two underlying problems:

First, there are two ways of thinking about, and therefore measuring, the rate of readmissions; and they often lead to quite different results and quite different decisions on penalties. One is discharge-based; the other, population-based. The relationship between the two is simple: (readmissions/discharges) X (discharges/(beneficiary population (1,000s) ) ) = readmissions / (beneficiary population (1,000s))

Patients who are admitted but die during hospitalization or are transferred to another hospital are not counted as discharges from the first hospital.

Second, effective interventions to reduce 30-day readmissions have an effect on admissions that extends far beyond 30-days after discharge and they reduce a lot of other admissions, especially if implemented in partnership with community providers and services.

When Congress created the MRRP, many stakeholders had become aware (and dismayed) that 20% of people enrolled in Medicare fee-for-service and discharged from a hospital were readmitted within 30 days of hospital discharge. Clinical trials had shown that improved processes around hospital discharges could prevent many of these readmissions. The aim of establishing accountability also made a hospital focus desirable. In this view, readmission is a burden resulting from poor hospital discharge processes, whether clinically premature or poorly executed. With that emphasis on discharge processes as cause and cure for readmissions, it was natural for the Centers for Medicare & Medicaid Services (CMS) to choose to estimate each hospital’s expected readmissions as the number of patients whom the hospital discharged and who would be expected to be readmitted after discharge from an average hospital. Most readmission reduction initiatives use this discharge-based readmission rate to measure performance. This discharge-based perspective effectively defines the readmission rate as the percentage of discharges that are followed by a readmission. In this way of thinking, the number of hospital discharges is simply a fact of life, much like the fact that a year has 365.24 days. This view does not see that hospital actions might reduce the number of patients they discharge, and this blind spot causes trouble.

Hospitals actually have a great deal of influence on how many patients they admit and discharge because so many of their discharges are admitted through their emergency department or by hospital-affiliated physicians and because they can collaborate with community services and providers who can forestall patients even coming to the hospital. Population-based hospital discharge rates vary substantially across regions, and they can change over time.

Some policy makers worried that the discharge-based rate could behave in unexpected ways if hospitals took steps that reduced total discharges by more than the reduction in 30-day readmissions. As a result, several programs, such as the Partnership for Patients and the Quality Improvement Organizations’ (QIOs) Care Transitions Program, were designed using a population-based readmission rate or converted to such a rate after evaluating early findings. The population-based rate is the number of readmissions for every 1,000 fee-for-service Medicare beneficiaries in the hospital’s service area. This view sees readmissions as a community health problem, a burden on a population of beneficiaries and the Medicare trust funds that is associated with that population’s use of hospitals just as hospital-acquired infections are associated with use of hospitals. From this perspective, preventing hospitalizations, improving discharge transitions, and improving post-discharge care are equally valid ways to reduce readmissions. Whether the hospital reduced hospitalizations in order to reduce readmissions is less important than being sure that we do not penalize hospitals for taking such steps. Population-based rates are closely aligned with the three-part aim of the National Quality Strategy (individual care, population health, and affordability), not only because they are population-based but also because they reflect the close relationship between care in the community and a hospital’s apparent performance.

Thus, a program can reduce burdens on beneficiaries and Medicare through significant reductions in the population-based discharge and readmission rates but see much smaller reductions in the discharge-based readmission rate. In a companion blog to this piece, Joanne Lynn presents evidence that this attenuation of changes in discharge-based rates has happened repeatedly in community-based readmissions programs. We do not know, at this point, whether attenuation of changes translate into financial penalties but it seems very likely to increase a hospital’s risk.

We also do yet fully understand what specific changes produce these decreases in the population-based discharge rate, but the most parsimonious explanation is that the causes are pretty much the causes of reduced readmissions: Provide urgent care with support for keeping the patient in the community, and you are likely to reduce all admissions, not just readmissions. Enroll more patients in medical homes, and the benefits will not disappear 30 days after hospital discharge. Improve nursing home communications with emergency rooms, and the benefits will not be limited to patients within 30 days after hospital discharge.

What we can foresee is that hospitals, already wary of readmissions reduction because it directly reduces revenue, will become doubly wary if they conclude that reducing discharges may also cause or increase the MRRP penalty. If CMS is penalizing hospitals and communities for succeeding at improving care and reducing costs, the reaction may threaten a very successful set of initiatives. The examples we report are for community-based efforts to reduce readmissions. Hospital-level calculations are generally beyond our capability. CMS can, however, easily determine whether, all else being equal, penalties are more likely or larger in areas where the population-based hospital discharge rate is declining substantially than elsewhere. That information is urgently needed.

What to do.

The purpose of the MRRP is to reduce the burden of readmissions on Medicare beneficiaries and the Medicare trust funds, so the important indicator of progress is the number of readmissions, not the percentage of discharged patients that are readmitted.

Healthcare quality measurement needs to catch up with the National Quality Strategy and add measures of the impact of care on the health of the population that will complement measures of the quality of individual episodes of care such as hospitalizations. In the case of readmission measurement for the MRRP, this need is substantially more urgent because there is good reason to fear that a hospital that engages with its community and does exactly what the MRRP hopes for is more liable to financial penalties under the current, discharge-based measure than it would be under a population-based measure.

The first step is to assess the degree of urgency by examining national evidence on actual penalties. If unreasonable penalties are at all frequent then the problem is far more urgent. This will be complex, because Epstein has already shown in cross-sectional studies that population-based hospitalization rates and readmission rates are positively correlated.[2] At the same time it will be important to develop population-based measures of readmissions and compare their impact on penalties with the impact of discharge-based measures. The obstacles are bureaucratic, technical, and political.

Bureaucratically, the most important obstacle has been a widespread belief that the Patient Protection and Affordable Care Act requires calculating discharge-based rates. In fact, the Act says only that penalties are to be determined from the ratio of observed to expected numbers of readmissions and is silent on how the expected number is to be calculated. The other bureaucratic problem is less tractable: Under current procedures, the steps laid out for implementing a new measure, both at CMS and at the National Quality Forum (NQF) would likely take several years. The process should be expedited if the analysis of current penalties indicates that hospitals are being penalized for success in reducing admissions.

The technical challenges of creating a population-based readmission measure for hospitals are substantial. First, the procedure must find a way to measure each hospital’s population-based hospitalization rate. Second, a method of risk adjustment must be developed and applied so that population-based readmission rates for each hospital and community can be compared. Although these methods are still evolving, adjustments for factors such as neighborhood deprivation[3] are actually easier at the population level. These are difficult tasks, but a first step good enough to improve on the existing model should be possible within a year.

Politically, hospitals will be concerned about accountability for the community hospitalization rate. They will recognize that if hospitals in areas with low hospitalization rates are protected, then hospitals in areas with high hospitalization rates will be more vulnerable.

Some have hoped that traditional risk adjustment could solve this problem, because the most likely scenario is that average risk of readmission increases as the number of discharges decreases. That prospect is not promising, because the most assiduous work on risk adjustment has produced tools of only moderate power. The prospects for solving this problem with improved risk adjustment are not promising.[4],[5]

When you find yourself in a hole you should stop digging. It seems prudent for NQF to suspend endorsement of the pending discharge-based readmission measures and for CMS to delay implementing discharge-based measures if NQF endorses them until CMS has studied and reported the extent to which readmission penalties punish hospitals that are actually reducing both admissions and readmissions and has laid out an approach to any problems found. Finally, the problem identified here underlines the importance of placing a population-based foundation under at least some measures of health care system performance.

Footnotes:

[1] Centers for Medicare and Medicaid Services. Readmission reduction program. Retrieved from http://www.cms.gov/Medicare/Medicare-Fee-for-Service-Payment/AcuteInpatientPPS/Readmissions-Reduction-Program.html

[2] Epstein, A. M., Jha, A. K., & Orav, J. E. (2011 December 15). The relationship between hospital admission rates and rehospitalizations. New England Journal of Medicine 365(24).

[3] Kind, A. J. H., Jencks, S., Brock, J., Yu, M., Bartels, C., Ehlenbach, W., & Smith, M. (2014 December 2). Neighborhood socioeconomic disadvantage and 30-day rehospitalization: a retrospective cohort study. Annals of Internal Medicine 161(11) 765-775.

[4] Yale New Haven Health Services Corporation/Center for Outcomes Research & Evaluation. (2014, July). 2014 measure updates and specifications: Hospital-wide all-cause unplanned readmission – version 3.0. Retrieved from https://altarum.org/sites/default/files/uploaded-publication-files/Rdmsn_Msr_Updts_HWR_0714_0.pdf.

[5] Kansagara, D., Englander, H., Salanitro, A., Kagen, D., Theobald, C., Freeman, M., & Kripalani, S. (2011 October 19). Risk prediction models for hospital readmission: A systematic review. Journal of the American Medical Association 306(15) 1688-1698.

twitterrssyoutube
Dec 082014
 
Dr. Joanne Lynn Portrait

By Joanne Lynn M.D.

[Also see companion post by Stephen F. Jencks, M.D., M.P.H.]

Care transitions improvement programs have been effective in helping the health care system both become more effective in serving people living with serious chronic conditions and reduce costs. However, the key metric used to measure performance is seriously malfunctioning in at least some hospitals and communities, leading to penalties and adverse publicity for providers and communities that are actually performing well and continuing to improve performance. In this post we provide supporting data, and a companion blog article provides a thoughtful discussion of the conceptual issues underlying this troubling malfunction. For our earlier blog post about this problem see: https://medicaring.org/2014/08/26/malfunctioning-metrics/.

Very simply, this problem arises because the metric used is some variant of readmissions (within 30 days) divided by discharges (from a particular hospital) within a particular period. Thus, the usual metric is something like “20% of Medicare fee-for-service (FFS) hospitalizations are followed by a readmission within 30 days.” This metric works well if the denominator, namely the number of hospitalizations, is not affected by the improvements that reduce the risk of readmission. If the denominator declines along with the numerator, the metric will not reflect the degree of improvement that was actually achieved. The data below show that this happens in real situations.

We are here showing the data from San Diego County, a very large county with about 250,000 Medicare FFS beneficiaries, who had about 60,000 Medicare FFS admissions to hospitals per year and about 10,000 readmissions per year in 2010, when almost all of the hospitals and the county’s Aging & Independence Services (functioning as the Community-based Care Transitions Program partner agency/Area Agency on Aging/Aging and Disability Resource Center) started working together to improve care transitions and reduce readmissions under the San Diego Care Transitions Program, one of the Community-based Care Transitions Programs initiated by Section 3026 of the Patient Protection and Affordable Care Act. The application year was 2012 and the start-up year was 2013. The table below shows an initial summary of their results, provided through their Quality Improvement Organization.

Exhibit 1: San Diego County: Relative Improvement by Metric, 30-day Readmissions

Exhibit 1: San Diego County: Relative Improvement by Metric, 30-day Readmissions

Readmissions of county Medicare FFS residents fell by 15% in 2013, compared with 2010. San Diego County reduced hospitalizations by 11%. However, when the numerator and denominator go down at nearly the same rate, the fraction moves just 4.3%, which falls far short of the 20% reduction goal that Medicare has set.

What follows are the quarterly data from San Diego. The first graph, Exhibit 2, shows the quarterly rate of admissions per 1,000 Medicare FFS beneficiaries in San Diego County. We have adjusted these data for the effects of seasons on admissions (since there are usually more admissions in the winter). The shaded portion shows the “control limits,” an area which represents the expected range of variation demonstrated in the first 3 years of the data (2010-2012). Data that fall outside of the range or that consistently run on one side of the midline indicate that something has changed in how the system is functioning. Clearly, admissions are falling.

San Diego Seasonally Adjusted Admissions

Exhibit 2: San Diego Seasonally Adjusted Admissions

The second graph, Exhibit 3, shows the readmissions rate in the same framework – quarterly rate of readmissions per 1,000 Medicare FFS beneficiaries in San Diego County, adjusted for seasonality. The control limits again show change. Readmissions are falling.

Exhibit 3: Seasonally Adjusted Readmissions

Exhibit 3: Seasonally Adjusted Readmissions

The third graph, Exhibit 4, shows the metric in the conventional form, readmissions divided by discharges. The graph does eventually show a decline, but only a modest one. The fact that the denominator was falling attenuated the impact of the falling number of readmissions.

Exhibit 4: Seasonally Adjusted Percent Discharges with 30-day Readmissions for San Diego County, by quarter

Exhibit 4: Seasonally Adjusted Percent Discharges with 30-day Readmissions for San Diego County, by quarter

The next three exhibits show the comparison of the San Diego measures with the national rates for the same metrics. Exhibit 5 shows that San Diego County is dramatically less likely to have Medicare FFS beneficiaries in the hospital than the nation as a whole: 56 per 1,000 per quarter in San Diego, compared with 69 per 1,000 per quarter nationwide. Exhibit 6 shows that San Diego is also much lower in readmissions than the national average: 10 per 1,000 per quarter in San Diego, compared with 12 per 1,000 per quarter nationwide. In both cases, the declining use is reasonably parallel between San Diego and the nation. This would imply that improvement strategies are still being effective at this lower range, and thus the lower range is not yet a limit on improvement opportunities. Exhibit 7 shows that San Diego County’s conventional metric of readmissions divided by discharges simply tracks the national average. Clearly, the metric is not functioning in a way that reliably separates good practices from wasteful ones. That readmissions over discharges metric does not convey the fact that San Diego is much less likely to hospitalize and to rehospitalize. Indeed, 10 of the 14 San Diego hospitals eligible for penalties for high readmission rates are being penalized next year. Since the calculations that go into determining the hospital penalty focus on particular diagnoses in three past years, it is possible that these hospitals manage to do badly with those diagnoses in those years, but it seems quite unlikely. More plausibly, the metric used is of the readmission divided by discharge form, so the shrinking denominator will affect this calculation.

Exhibit 5: Seasonally Adjusted Quarterly Admissions, National and San Diego County

Exhibit 5: Seasonally Adjusted Quarterly Admissions, National and San Diego County

Exhibit 6: Seasonally Adjusted Quarterly Readmissions, National and San Diego County

Exhibit 6: Seasonally Adjusted Quarterly Readmissions, National and San Diego County

Exhibit 7: Percentage of Quarterly Discharges Readmitted, National and San Diego County

Exhibit 7: Percentage of Quarterly Discharges Readmitted, National and San Diego County

Without access to and analysis of much more data, one cannot know how widespread this problem is. We do know that San Francisco had an admission rate of just 50 per 1,000 per quarter in 2013 and a readmission rate of just 8 per 1,000 per quarter, which are rates much lower than San Diego. Yet 8 of San Francisco’s 10 eligible hospitals will be penalized for excessive readmissions in 2015. Furthermore, we know that the initial Medicare foray into this work, published in the Journal of the American Medical Association in January 2013 (link: http://jama.jamanetwork.com/article.aspx?articleid=1558278&resultClick=3 “Association Between Quality Improvement for Care Transitions in Communities and Rehospitalizations Among Medicare Beneficiaries”, see “Outcome Measures”), involved 14 smaller communities, and that project had to change from using the discharge-based metric to using the population-based metric when it became clear that the shrinking denominator was making the project monitoring unreliable.

Hospitals, other providers, and communities that believe they may be adversely affected by the malfunctioning metrics should have access to the data needed to investigate and CMS should welcome reconsideration of those situations. NQF should suspend endorsement of new readmission/discharge metrics and re-examing existing ones. CMS has multiple contractors working on readmissions, and some have substantial experience and skills in the technical details of these metrics. CMS should quickly modify their contracts to require them to investigate the extent of this problem, to identify steps to ameliorate adverse impacts of the current readmissions/discharges metrics, and to build the metrics that can guide care transitions work into the future. Certainly, the time has come to sort this out and develop metrics that reliably separate exemplary from persistently inefficient practices.

Want to know more?

“Protecting Hospitals that Improve Population Health” by Stephen F. Jencks.
https://medicaring.org/2014/12/16/protecting-hospitals/

“Senior Alert: A Swedish National Dashboard for Preventitive Care for the Elderly” by Elizabeth Rolf.
https://medicaring.org/2014/12/22/senior-alert/

twitterrssyoutube