Sep 182019
 
Portrait of Joanne Lynn
Dr. Joanne Lynn, MD

By Joanne Lynn

Within just a dozen years, the U.S. will have nearly double the current number of frail and disabled elderly people needing daily supportive services. Look around! What is being done to prepare for this expectable increase? Already most cities have long waiting lists for home-delivered meals, and no city in the U.S. has adequate affordable disability-adapted housing. We have all sorts of improvements “proven” to work in research or demonstrations, but we have no long-term plan. A recent Health Affairs article showed that most of the people who retired from “middle class” jobs will be unable to afford housing and health care within a decade.

America mostly deals with issues no more than a few years into the future. But private savings for supportive services in old age requires planning more than 30 years ahead – the person at age 50 has to plan for the risks at age 80 and beyond. And the nation has no real plan for how to arrange savings, taxes, and services to keep frail and disabled elders having food, shelter, and personal care. Indeed, even the Presidential candidates don’t debate these issues!

Delaying action until the suffering is so widespread and severe that taxes rise to support more of what is already haphazard and costly “care” would severely weaken the economy and curtail needed investments in other areas, such as childhood development and transportation infrastructure.

One clever proposal calls for federal coverage of long-term care after a period of need that depends upon the person’s lifetime earnings. If low-wage earners had to cover a year and high-wage earners had to cover 5 years, the cost would be less than 1% added to the Medicare tax. And we’d suddenly have long-term-care insurance vehicles that are affordable and widely purchased.

Well-proven improvements in medical care, preventive services, housing, and food delivery are easy to identify – they just need to be demanded and implemented.

In an editorial in the Journal of the American Geriatrics Society, I have called on all of us who serve frail and disabled elderly people to speak up – to push civic leaders for urgent planning and policy improvements. Click here to read the editorial – and then take action! Find a few other people willing to speak up! Get organizations to push for attention to these issues! It’s our future, claim it and make it better! Let us know how to help.

twitterrssyoutube
May 082019
 
Portrait of Dr. Joanne Lynn
Dr. Joanne Lynn MD

By Joanne Lynn

May 7, 2019

CMMI has announced that they will soon call for proposals for a bevy of new payment models, aiming to reduce hospitalization without harming quality by allowing a great deal of flexibility by practicing primary care clinicians for Part A and Part B services in Medicare and by allowing contracting for services for larger groups of beneficiaries. Effectively, CMMI is offering practitioners and other stakeholders a group of models that blend capitation and fee-for-service, with payments generally depending upon lowering hospital use, meeting quality standards, and making certain continuity services available (e.g., 24/7 on-call with the record and electronic records with interoperability). While many of the details are not yet clear, I believe that these models could offer some important opportunities for moving toward optimal care for elders living with serious illnesses and disabilities.
The publications so far have not really dealt with long-term care, supportive services in the community, or integration with Medicaid. But they also have not made these things any more difficult.
As a very brief overview, CMMI is offering two groups of models: Primary Care First and Direct Contracting. This table summarizes what I’ve been able to learn as to the characteristics of the proposed models. All models appear to require having some experience with value-based payments, having certified electronic records with interoperability and connection to the local HIE – and providing primary care. From one perspective, Primary Care First is a successor and spread of CPC+, and Direct Contracting is a successor and spread of NextGen ACOs. More information can be found on these URLs:

https://innovation.cms.gov/initiatives/primary-care-first-model-options/

https://innovation.cms.gov/initiatives/direct-provider-contracting/

And here is an introductory table.

2019 CMMI Proposals Table

Note that practices now participating in CPC+ cannot join Primary Care First until 2021. The areas where Primary Care First will be allowed in 2020 are these:

Alaska (statewide), Arkansas (statewide), California (statewide), Colorado (statewide), Delaware (statewide), Florida (statewide), Greater Buffalo region (New York), Greater Kansas City region (Kansas and Missouri), Greater Philadelphia region (Pennsylvania), Hawaii (statewide), Louisiana (statewide), Maine (statewide), Massachusetts (statewide), Michigan (statewide), Montana (statewide), Nebraska (statewide), New Hampshire (statewide), New Jersey (statewide), North Dakota (statewide), North Hudson-Capital region (New York), Ohio and Northern Kentucky region (statewide in Ohio and partial state in Kentucky), Oklahoma (statewide), Oregon (statewide), Rhode Island (statewide), Tennessee (statewide), and Virginia (statewide).

The RFI for the Geographic Direct Contracting Model is at https://innovation.cms.gov/Files/x/dc-geographicpbp-rfi.pdf DATES: Comment Date: To be assured consideration, comments must be received by Thursday, May 23, 2019 at 11:59 pm EST. ADDRESSES: Comments should be submitted electronically to [email protected].

There are dozens of ways to implement these, and I hope that CMMI will allow diversity and will be clever in the evaluations, aiming to harvest insight and wisdom as well as comparisons with past performance and unaffected beneficiaries. However, if they allow contractors to put together the geographic and the serious illness endeavor, we could have a model that would fit the seriously disabled or slowly dying elder well. We could have communities with exemplary performance within a few years, and tremendous experience to build upon.

I would very much like to know whether you, the reader, are in a position to encourage potential sites to be ready to submit a letter of intent soon after the RFPs come out in June (for all except the Geographic Direct Contracting). If you are interested in shaping the RFP for Geographic Direct Contracting, the deadline for comments is May 23, 2019. If our coordinating information is useful to you or a colleague, please be in touch with us at [email protected]. We aim to put together communications as appropriate in order to accumulate best practice ideas concerning eldercare and to devise approaches that might allow optimization of local care systems quickly! We are happy to help any organization focusing on elders who are living with frailty, disabilities, and illnesses that need long-term supports and services and generally are eventually contributing to the end of life.

twitterrssyoutube
Dec 182018
 
Portrait of Dr. Joanne Lynn
Dr. Joanne Lynn, MD

By Joanne Lynn

“Starting in 2020, we are going to be expanding that range of [Medicare Advantage] benefits…to include home modifications, home-delivered meals, and more.” — Alex Azar, Secretary of HHS [The Root of the Problem: America’s Social Determinants of Health, November 14, 2018, as prepared for delivery]

Aha! Medicare leadership is awakening to the fact that elderly people living with disabling conditions need comprehensive care that includes supportive services. Without those, frail elders run up unnecessary expenses for Medicare, particularly when the only way to get help is to go the emergency room. People who can’t get out and about need nutritious food delivered to their homes – and we need homes where wheelchairs can get into the bathroom, and from which disabled persons can escape during an emergency. When we can’t take care of our daily needs, we need help with meals, hygiene and transportation. Virtually all of us will need this help for at least a couple of years if we live to advanced old age, for ourselves or for those we love and honor. There are sound ways we can provide for this through policy and adaptation of current care systems. One way is through newly expanded MA supplemental benefits which enable MA plans to offer partial coverage for long-term services and supports (LTSS).

The CHRONIC Act, part of the Bipartisan Budget Act of 2018, frees Medicare to start allowing MA plans to offer supplemental benefits in conjunction with a personal care plan in calendar year 2020, which requires that the proposals be submitted to the Centers for Medicare and Medicaid Services (CMS) by the end of June 2019. Already, MA plans that chose to submit bids for 2019 including some LTSS services may offer a narrower range of supplemental benefits to all with designated conditions in a particular county. In general, MA plans can choose to offer supplemental benefits if they decide they can do so for less than the capitation that Medicare is expecting to pay. In the past, these benefits have been limited to services that are tightly tied to health care, including eyeglasses, and diabetes supplies, and those services had to be available to all beneficiaries in the plan.

Secretary Azar and others are pleased to point out the merits of avoiding hospitalizations and skilled nursing facility stays for beneficiaries who can be served at lower cost with additional support “at home.” It’s a good thing for Medicare to take note of the urgent need for the basics of daily living – food, hygiene, clothing, shelter, socialization, and mobility. People who need help with these basics in old age also need caregiving, and Medicare is making efforts to help caregivers, for example, by redefining respite and in-home support services to be included in permissible supplemental benefits. In addition, policy changes should allow Medicare to help volunteer and paid caregiving by including requirements for reasonable training and support for communities providing adequate back-up for caregivers.

Gaps are Wide Today

Yet there is still more we must do. How is it that this prosperous country can publish a study of home-delivered food that randomized 626 people in 8 cities who were on waiting lists longer than 6 months, needing home-delivered food? The three groups received
(1) 5 meals delivered daily on weekdays,
(2) 5 frozen meals delivered each week, or
(3) nothing
(Thomas KS, Dosa D. More than a Meal Pilot Research Study: March 2015. at https://www.mealsonwheelsamerica.org/docs/default-source/News-Assets/mtam-full-report—march-2-2015.pdf ) How does it not count as a scandal that one-third of the study participants were left without food? Indeed, how does it not count as a scandal that the study could readily find 8 cities with more than 6 months waiting for home-delivered food?

MA plan supplemental benefits might help reduce the inadequate supply of supportive services, but there are risks to using medical care to address social needs. To start, getting housing through a physician has to be an expensive way to provide housing. Perhaps more important, who will get supplemental services in a capitated medical care system? Surely, it will be people who are likely to spend less on medical care if they have the services. These will be enrollees who have established a track record of high-cost medical care, or who are reliably predicted to do so. But over time, many people will realize that the way to get urgently needed LTSS services is to go to the emergency room a few more times. Perhaps before that, they will sign up for MA plans that have these supplemental services. Inadequate risk adjustment may therefore pose a risk of adverse selection for plans, while promoting perverse behaviors on the part of beneficiaries.

Even more troubling is the moral question of feeding (or housing or otherwise supporting) people mainly because they are costly, rather than because they are very much in need. Imagine two neighbors, Ida and Emma, both 90 years old, hearing-impaired and visually limited, and who use wheelchairs to get around their small apartments due to failing hearts and bad hips. Ida is very nervous about her health and has a physician whose response to any urgent call is, “Go to the ER.” She ends up in the hospital every few months. Emma, on the other hand, believes that things will take their course and you should only use a hospital when there’s something specific that hospital care can fix. Her primary care physician also serves the local hospice program and does house calls when needed. She hasn’t been in the hospital since having her last child 50 years ago. Indeed, she has not seen her physician for some years, relying instead on telephone advice from the office.

Both women live on Social Security at just above the Medicaid income eligibility threshold, and they juggle the cost of rent, pills, co-pays, heat, and food. Neither has family nearby and all their old friends have died. Recently, both of them have become sufficiently disabled that they cannot shop for food and can only heat things up in the oven or microwave. Is it really acceptable that the supplemental benefits from the MA plan ensures that Ida gets home-delivered food regularly, but Emma does not, and that Emma’s life may be shortened due to lack of good nutrition (and socialization, as the More than a Meal study showed)? We don’t calculate the impact of a deficit of supportive services at this point: Rather, earlier death is attributed to age and various maladies. Not acknowledged are the months Emma spends hungry and alone. This is poor care, and we need Medicare to take additional steps to address LTSS – both for enrollees of MA plans, and the millions of Medicare beneficiaries who prefer to be in the fee-for-service system or other non-MA care arrangements.

In addition to supportive services, good eldercare arrangements make physician coverage much more reasonable. Both of these ladies are likely to need ongoing personal care at some point. MA plans are not likely to provide more than short-term help with in-home aides – it is just too expensive and doesn’t save hospital care much. Instead, good care at home saves on nursing home care, but that is not covered by Medicare. Ida and Emma are therefore likely to end up spending down quickly to Medicaid and having to move from their homes to a nursing home (and giving up all but a pittance of their income). Even in states with managed Medicaid LTSS for elderly persons, those plans are often not the same as the MA plans, and concern for spending down and nursing home placement is not often a pressing concern for the MA plan.

Things are even more challenging when it comes to family support. What should we expect of family? What if Ida had multiple attentive family members willing and able to bring in food, help with household repairs, provide transportation, and so on – while Emma had only the grudging support of a small group of elderly relatives living some distance away? What if the situation is even more complicated by a history of abuse? This country has had little discussion of what can reasonably be expected of relatives or neighbors when a person becomes disabled and needs help.

Another major issue that is rarely spoken about is this: how can we account for the effects of our choices on our lifespans, given that survival is expensive once you need near-constant help from another person? This and family support are among the elephants in the room, with too little honest discussion to shape good public policy.

How can we adopt a more useful and accurate vision of what it takes to ensure adequate supportive services for all elderly people? One way to do this is to start with the simple premise that individual people have varying needs that evolve over time, and addressing them requires that they be connected to local entities that have a mission of addressing those needs. In other words, services must be organized to be adequate by geographic community. No physician can conjure up housing that is affordable and adapted for a disabled elderly patient if that sort of housing is not available in the area where that elder lives. If there is a long waiting list for home-delivered meals, there is virtually no opportunity to ensure that what a particular person needs can be met. No one physician, nurse or other provider, or family member or friend, can generate the trained workforce needed, or convince area employers to have flexibility to enable family caregiving.

To get a handle on whether a particular community has adequate service capacity, we need metrics that can gather information about and publicly display what a local system’s overall performance is vis-à-vis eldercare, and its ability to improve. We also need examples of governance arrangements that develop into entities that can take on the responsibility of monitoring and managing the performance of a local eldercare system. This entity needs data and the authority to prioritize the use of some resources.

Some MA plans could do this, for example in areas where an MA plan dominates the local health care market or where the various providers and payers learn to cooperate in the public interest of better eldercare. Under current policy, an initial “demonstration” phase could take place in designated counties where payers, providers, and civic leaders are willing to measure and monitor their eldercare system’s performance according to selected dimensions and are able to establish an entity that is charged with setting priorities and taking action. If we can get a dozen counties to test this approach, we can quickly learn what reliable and effective eldercare looks like, and how efficient it can actually be. In a locally driven framework, the new MA supplemental benefit availability would become part of achieving better eldercare across the community.

twitterrssyoutube
Sep 252018
 
portraits of Anne Montgomery and Sarah Slocum
Authors Anne and Sarah

By Anne Montgomery and Sarah Slocum

On May 4, 2018, the Michigan State Legislature voted to “just do it:” to assemble a group of experts to craft a blueprint for taking the Wolverine State deep into the future of Michigan’s age wave – all the way through the mid-21st century.

Specifically, the language requires the Michigan Department of Health and Human Services (MDHHS) to contract for: “an independent feasibility study and actuarial model of public, private, and public-private hybrid options to help individuals prepare for, access, and afford long-term services and supports.” The study will take 9 months. It is meant to squarely address the fact that current options for individuals to fund their long term supports and services (LTSS) needs have been unworkable and have often resulted in impoverishment and bankruptcy for Michigan families.

Since Medicare doesn’t pay for LTSS and less than 10% of Americans have purchased private long term care insurance, most people have to pay out-of-pocket when they need in-home care, assisted living, or nursing home care. This continues until the disabled person qualifies for Medicaid, which picks up the cost of nursing home care. Or, if there is an available program for home and community-based services (HCBS) that doesn’t have a waiting list, families may be able to tap into Medicaid for in-home services and other types of assistance.

Along the way, thousands of formerly middle-class families in Michigan are forced to impoverish themselves every year in order to qualify for Medicaid LTSS coverage. This “spend down” process is anguishing for many, who would prefer to have more control over their lives and perhaps to leave some of their accumulated resources to children and grandchildren. Recognizing this, the Michigan legislature, led by Rep. John Hoadley (D-Kalamazoo) and Sen. Margaret O’Brien (R-Portage), went to work last year — along with a coalition of concerned organizations led by Michigan United and including Altarum’s Program to Improve Eldercare – to ensure that the study bill would become law.

The Michigan budget for fiscal year 2019, which begins in October, includes language directing the Department of Health and Human Services (MDHHS) to draw up a workable, practical plan that will make LTSS available to middle-class Michigan families. MDHHS has $100,000 in state funds that will be matched with at least that much in private philanthropic funds – and possibly far more — to take a hard look at LTSS financing possibilities, workforce development capacity and future needs. The study will assess the current landscape of long-term care needs including:

  • What private and public services exist;
  • What the costs for current services are;
  • Who is accessing them and who is not;
  • What are the challenges to accessing care, including the gaps in services;
  • The impact that care has on the care workforce and family caregivers.
  • The primary goal of this study is to assess the cost and impact of three main financing proposals:
  • o A long-term care benefit for all Michiganders;
    o A public-private risk-sharing insurance program that reimburses insurers;
    o A long-term care benefit for those who do not qualify for Medicaid.

Today, Michigan Medicaid spends almost $3 billion per year on LTSS — and the cost goes up each year. But Michigan families spend more. AARP Michigan reports that Michigan families provide $15 billion worth of uncompensated care each year. New options are needed to keep both the state budget and Michigan families healthy during the state’s “age wave” era.

On the workforce side, Michigan is already facing shortages of people able and willing to fill direct caregiving jobs. MDHHS will engage experts to examine what supports current workers need to remain in the LTSS workforce: e.g., career ladders, benefits and wages to make LTSS jobs more attractive, and workplace conditions to make LTSS jobs safer and valued to attract candidates and keep them. Overtime and turnover due to stressed staff are major cost centers and major causes of staff shortages. The LTSS study will examine all of these factors and create new solutions to make LTSS jobs a career option for many more people.

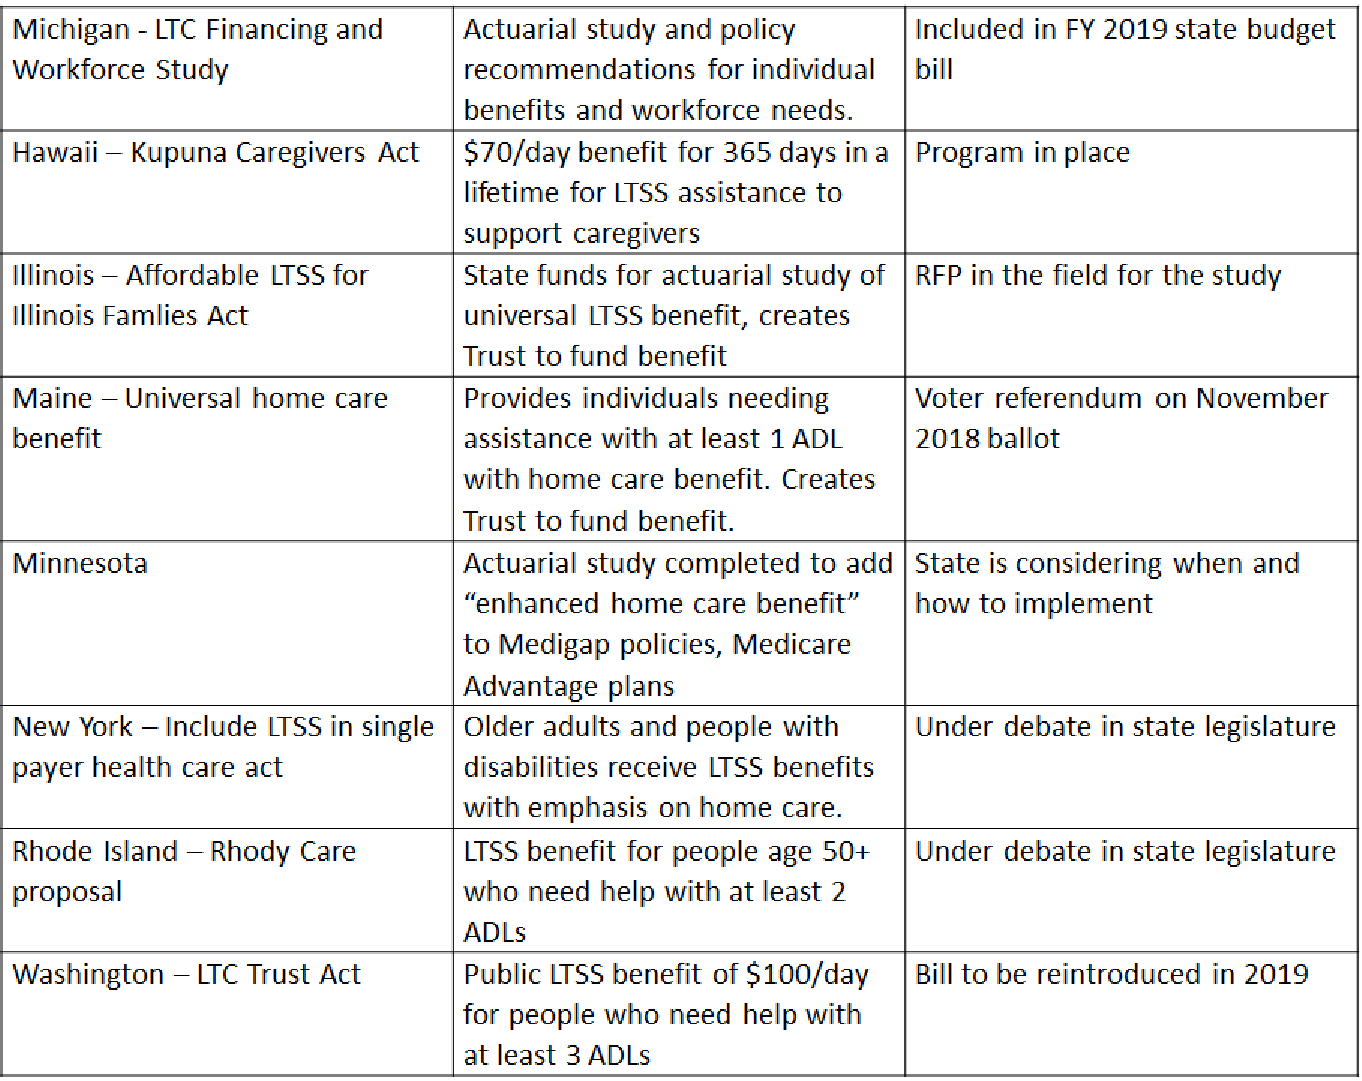
Similar studies in the states of Washington and Hawaii have resulted in major changes to how LTSS is delivered and paid for in those states. The AARP Long Term Supports and Services Scorecard ranks these states respectively first and seventh in the nation on an array of measures. Washington and Hawaii have used results of LTSS studies to develop much better options for individuals and workers. Michigan is overdue for a serious examination of issues in financing and staffing LTSS, and this opportunity will jump-start major innovations. In the absence of a national strategy or plan for affordable high quality LTSS, several additional states are pursuing state level action. The chart below provides some current examples:

The current environment of long term care in Michigan includes over 40,000 nursing home beds in about 430 facilities, another 40,000 beds in about 4,500 Adult Foster Care Homes, and 10,000 beds in about 190 Homes for the Aged. An unknown number of unlicensed Assisted Living facilities operate in Michigan, serving an unknown number of people. In addition, another unknown number of people are getting care through visiting nursing services, private duty home care, and other unlicensed businesses offering various services. Medicaid also funds 11,000 Medicaid HCBS beneficiaries through the “MI Choice” program, and over 3,000 beneficiaries (the vast majority are dually eligible) through 10 PACE organizations (Program for All Inclusive Care for the Elderly). Michigan is home to nearly 1.9 million Medicare beneficiaries, of whom almost 300,000 are also eligible for Medicaid.

Experts estimate that 50% of the Medicare population will need long term care at some point in their lives. In Michigan and around the country, elders are the fastest growing segment of our population – so the need for LTSS, which seems high today, is set to increase steeply over the coming years.

To put some financial parameters around this discussion, nursing home care costs Michigan’s Medicaid budget $1.7 billion dollars per year; private pay rates in nursing homes range from $9,000 to $11,000 per month. Adult Foster Care and Home for the Aged monthly rates range from $800 to $5,000 for those able to pay privately. Michigan spends another $350 million on MI Choice and PACE, both of which have lower monthly costs than nursing home care. Area Agencies on Aging and other community organizations provide supportive community services, but their budgets are quite limited and have not seen the significant budget increases needed to keep pace with the growing aging population.

The costs to individuals and families of unplanned, poorly coordinated LTSS are also very high: First there are substantial “out-of-pocket” costs associated with in-home services, equipment, medications and more medical procedures and visits; second are the high costs to family caregivers, who may face the loss of their jobs and their own livelihoods as care needs increase. Some families may also find it necessary to move to different housing that can accommodate an ill or disabled family member’s needs for disability access, thus incurring the costs of moving. Many families struggle and figure out how to cope for a while, and later give up – leading to costly nursing home admissions. Others simply go bankrupt.

Like other states, Michigan must devise ways to stretch publicly financed health care dollars further to support LTSS. For families, LTSS must be made more affordable and reliable – and delivery systems must shift to services that can readily be delivered at home. The workforce that delivers this care must be well-trained, supported, and paid a living wage to assure quality and continuity of services. With advocates, researchers, policymakers and funders at the table, the Michigan LTC study is a prime opportunity to create smart adaptations to existing programs, and to create new and more efficient initiatives. Both will serve as investments in the future.

twitterrssyoutube
Jul 052016
 

New York, New York, July 5, 2016—A new financial simulation for a novel model of care, called MediCaring Communities, has shown significant Medicare savings for frail older adults who need both medical care and nonmedical support services.

Medicare savings ranged from $269-$537 dollars per person per month, depending on the community, its past patterns, and the pace of change anticipated. The four communities in the simulation were Akron, OH, Milwaukie, OR, Queens, NY, and Williamsburg, VA.

The U.S. could provide much better care for disabled and sick elderly people without exceeding what we now spend, the study shows. The team estimated enrollment and effectiveness of improvements, using local experience and research data.

These findings, from Altarum Institute’s Center for Elder Care and Advanced Illness (CECAI) [now Program to improve Eldercare] in partnership with Dobson DaVanzo & Associates, LLC, were published today in The Milbank Quarterly.

In the model, medical services were reconfigured to improve the experience of frailty in old age, starting with a comprehensive, elder-driven care plan constructed to reflect each older adult’s specific situation, prognosis, and personal priorities. Added to the mix were improvements to ensure that supportive long-term care services were reliable and readily available.

The financial simulation included Medicare beneficiaries with dependencies in two activities of daily living or cognitive impairment necessitating constant attendance.

“This model will be successful if just some of these savings from high-cost medical services are invested in nonmedical in-home support,” said Joanne Lynn, MD, CECAI director. “It should be easier for a disabled elderly person to get home-delivered meals, or for a family caregiver to get a few days relief, than it is for a doctor to prescribe a $10,000 pill. At present, we have our priorities wrong.”

“Programs already exist that could make this happen if CMS (Centers for Medicare & Medicaid Services) allowed it. Accountable Care Organizations and the Program of All-Inclusive Care for the Elderly (PACE) would be terrific foundations for a MediCaring Community,” continued Lynn. “To address the needs of millions of seniors, we must use the next few years wisely, aiming to deliver much more reliable and comprehensive care to high-cost elders—without increasing the costs. Now is the time to take these lessons and use them to change how we help older adults, and bolster programs across the country that will help elder communities thrive in the oncoming ‘age of longevity.’”

Contact: Judith Zimmer [email protected] 212-355-8400

About Altarum
Altarum (www.altarum.org) integrates objective research and client-centered consulting skills to deliver comprehensive, systems-based solutions that improve health and health care. Altarum employs almost 400 individuals and is headquartered in Ann Arbor, Michigan, with additional offices in the Washington, D.C., area; Portland, Maine; and San Antonio, Texas.

About The Milbank Quarterly
Continuously published since 1923, The Milbank Quarterly features peer-reviewed original research, policy review, and analysis from academics, clinicians, and policymakers. The Quarterly’s multidisciplinary approach and commitment to applying the best empirical research to practical policymaking offers in-depth assessments of the social, economic, historical, legal, and ethical dimensions of health and health care policy. The Milbank Quarterly is published in March, June, September, and December on behalf of the Milbank Memorial Fund by John Wiley & Sons. www.milbank.org/the-milbank-quarterly

twitterrssyoutube
May 312016
 

By Joanne Lynn

Medicare fee-for-service (FFS) beneficiaries with advanced illnesses and worsening disabilities, and the clinicians who focus on serving them, could wind up becoming big losers if MACRA (Medicare Access and CHIP Reauthorization Act of 2015) is implemented without sufficient attention to the realities of caring for these vulnerable populations. But there are ways in which we just might thread the needle and come out with sustainable excellence. Our future will depend a great deal on sustained activism by consumer advocates, clinicians, and caregivers, along with a heavy dose of thoughtful model-building.

MACRA is the payment scheme that replaces Congress’ annual drama of delaying implementation of the “Sustainable Growth Rate” payment system, which would have adjusted FFS reimbursements for physicians downward each year since 2002. MACRA directly affects only Medicare Part B payments. These are mostly payments to physicians but will also affect other provider reimbursements as well. The statute is complicated, and the proposed regulations run almost 1000 pages, but the potential impact upon the care of frail and disabled elderly people and their clinicians is easy to trace.

Physicians (and most others who are paid under Part B, such as nurse practitioners,) will automatically be in the “MIPS” (Merit-based Incentive Payment System) of MACRA. That looks to be very challenging for clinicians who focus on serving very sick and disabled elders. Each physician’s payment will be adjusted by a score that depends upon four factors: quality, cost, information technology (IT) use, and improvement activities. Quality measures Medicare now uses are mostly irrelevant to this population (e.g., cholesterol and lipid management and cancer screening) and some are even harmful (e.g., conventional diabetes and hypertension control). A few calamities give rise to relevant quality measures, such as onset of pressure ulcers or falls with injury, but these are rare events, even in high-risk populations, and most physicians won’t have many. Furthermore, our eldercare patients are costly, often in ways that are not captured in risk adjustment, such as having inadequate family caregivers or displaying very difficult behavioral problems. And nursing homes, assisted living centers, hospice programs, and home care have never received the federal funding and technical assistance needed to launch and integrate information technology, so performing well on IT use is going to be difficult.

Therefore, practitioners focused on frail and sick elderly people are sure to lose in MIPS, which has to stay revenue neutral: the model is designed such that every physician who “wins” in MIPS has to have a counterbalancing physician who “loses.” How badly geriatricians will lose will depend upon who they are compared with, but there’s no comparison group in which we can “win.” Since it is already very difficult to justify working in geriatrics, where clinician incomes are lower than other primary care, this will be a severe blow. We should rally to improve the metrics in MIPS, but that will take time and might never work adequately.

But there is another part of MACRA, called APMs, for Advanced Payment Models. Being qualified to be paid under an APM will earn the clinician a 5% bonus, without the downside risk of MIPS, as described above, and with a much better update in the fee schedule over time. The requirements for APMs are not settled yet, but some form of patient-centered medical home and accountable care organizations will count (as required by statute). Medicare’s new Comprehensive Primary Care Plus (CPC+) will qualify. Basically, an APM has to aim to improve care and reduce costs, and to have the clinical service provider take on more than nominal risk. Clinical specialty societies of every stripe are jumping on board with working parties around particular procedures or diagnostic categories—creating dozens of potential APMs.

However, our elders with frailty, disability, or advanced illness can’t effectively be carved up into procedures and single diagnoses. When we are old and sick, we need comprehensive care planning, reliability across time and settings, attention to the burdens on family and the costs, comfort, respect, and meaningfulness, and, finally, life closure. These are fundamentally not episodic or time-limited, nor restricted to one domain of specialization. Arranging home-delivered food may be more important than managing diabetes. Indeed, what matters is radically up to the elder and family—no one set of conventional quality measures could address the variety of situations, preferences, and possibilities. The quality measures that will matter most will include alignment with the elder’s goals, and ongoing evaluation of the performance of care plans. Of course, understanding that alignment requires having come to know the patient and family situation, values, preferences, and goals—a knowledge set that is remarkably absent from most modern medicine and virtually all health records.

So, the APM that geriatrics needs will look very different from those of most other “specialties,” precisely because it will be comprehensive, enduring, and allegiant to the elder’s priorities. I am not sure what will work. Ideally, a geriatrics APM might include showing that the clinical provider stays with patients across time and settings; provides 24/7 on-call responsiveness with a comprehensive care plan in hand; engages with one or more community boards that have authority to monitor the elderly population’s well-being and to have a hand in managing the local eldercare delivery system; and has a high rate of patient/caregiver reports of good care planning. Such a provider might still bill the conventional FFS, but perhaps the chronic care management fee would be a more substantial part of the payment package, and the patient would be protected from co-payment (as it is in CPC+).

Although the details of MACRA and proposing an APM are daunting, the advocates for the frail and disabled elders need to work together to make their voices heard and propose one or more APMs. At a meeting of the recent technical advisory committee (the PTAC) that will advise Medicare as to the acceptability of proposed APMs, person after person representing specialty societies and major health care funders made their interests known while I was the only representative of geriatric clinicians and families. Medicare pays most of the bills for elders in decline, and Medicaid pays another large proportion. Families pay most of the rest. More than any other patient group, this group is the heart of Medicare. Yet, this phase of life is at risk of being left out of the planning altogether, for lack of strategic advocacy.

Of course, our clinicians have overwhelming responsibilities and low incomes, and our professional societies are much less well-financed than most other specialties. We have not been able, in general, to support centers that can handle registries, claims analysis, and policy modeling. Furthermore, our patient advocates are likewise limited, with the larger ones focused upon earlier, healthier, stages of aging, though we have important but small, focused advocacy organizations around particularly troubling issues like nursing home abuses and legal rights under federal programs. While cancer and heart disease have strong research, consumer, and clinician organizations, geriatrics and palliative care populations and those who serve these populations have few such resources.

What is the better course? First, all who care about their futures as elderly persons, or as caregivers, or as clinicians and service providers should quickly plan and strategize, and we should all get behind one or more comprehensive models. A worthwhile model needs to be more comprehensive than the research-supported models like home-based primary care, or GRACE, or INTERACT. It also needs to be sustainable from the start. MACRA’s PTAC has proposed a process that would enable them to devote some funds to developing models. We should advocate that this support go especially to the otherwise disadvantaged field of eldercare. We could build a collaborative effort by a wide variety of provider and consumer groups. None of these groups has the funding, the skills, and the will to put together a winning APM on its own, and half-formed competing models would reduce our effectiveness. Together, we could aggregate resources and get behind a useful model or a few—and win!

Rather than having only MIPS, which is likely to disadvantage geriatrics and palliative care, or APMs established to advantage fragmentation, we could end up with a good payment model that supports elders, their families, and their service providers. It still might be true that this phase of life should generally be paid in a capitated or salaried system. However, for now, most Medicare patients are still in FFS arrangements. Clinicians who are willing and able to serve this difficult population must be able to make a living providing the right services. Otherwise, care for elders living with frailty, disability, and advanced illnesses will fare badly, and all of us will suffer when it comes our turn.

For more information:
Administration takes first step to implement legislation modernizing how Medicare pays physicians for quality (HHS)

MACRA Quality Payment Program (CMS)

To push this agenda, write to [email protected] and talk with your consumer and professional groups about participating in formulating a plan, and then getting behind it.

twitterrssyoutube
May 192015
 

By Joanne Lynn

Very, very dysfunctional. You need evidence? Try these two tales.

First, a remarkably illuminating piece of research was released on March 2 concerning the Meals on Wheels program (http://www.mealsonwheelsamerica.org/docs/default-source/News-Assets/mtam-full-report—march-2-2015.pdf?sfvrsn=6). The title was “More than a Meal,” and it showed that people who got warm meals home delivered by volunteers 5 days per week did better in many ways than people who got frozen food delivered once a week and much better than those who were on a wait list for Meals on Wheels. That finding was not surprising: Our mothers could and did tell us enough to expect that finding, though it is good to have it properly documented.

What is so profoundly dysfunctional is that there were eight U.S. cities participating that each had waiting lists for Meals on Wheels of more than 6 months. That’s right: The program to provide food so that elderly people could stay at home, live with dignity, and count on a friendly face coming by on most days has a waiting list longer than many needy people’s life spans. What happens when cities build up 6-month waits for food? Most on the waiting list can’t shop; most can’t cook. Some neighbors help out. Some find enough money to get fast food. Many get sick or dizzy and end up in the emergency room, the hospital, and then a nursing home. All are hungry, and none thrive.

The cost of home-delivered meals for a year is less than just the ambulance trip to the emergency room. The cost of one hospitalization would pay for a hundred people for a month. Yet we are primed to provide the ambulance and the hospital but not lunch! The funding for Older Americans Act services has increased less than 5% in a decade, while the funding going to Medicare has doubled. These priorities were not set by 88-year-old women living alone in poverty but by much younger men scared of heart attacks and wanting assurance of rescue.

But wait; there’s another story. This one is about my mother, now in her 94th year. She caught a cold, which progressed to pneumonia, and she was quickly in a precarious state. The craziness started when her primary care physician, making a home visit (yes, a home visit!) noted that my mother could not get a good broad-spectrum antibiotic except by going to the emergency room, because all pharmacies near her small-county seat in western Pennsylvania were closed on Saturday night and all day Sunday. Feeling like a participant in a modern-day Iditarod, I got the antibiotic and drove 4 hours to deliver it, and it actually did the trick. My mother turned the corner within 12 hours and was breathing much easier by Sunday afternoon.

But then she was very weak and severely dehydrated, which causes nausea, and therefore she required some way to accomplish hydration other than just by drinking fluids. I asked about home health care getting her some intravenous fluids. The answer: That would take 48 hours to set up. I asked whether I could buy or slip away with the fluids and an IV setup; after all, I’m a physician. That would break too many rules. I stumbled onward, asking what would happen if my mother were in hospice. Miracle delivered! In hospice, she could have an IV at home that day! Her primary care physician agreed that without something changing, her prognosis fit the hospice requirements, and having an IV could hardly count as “curative” medicine—except, of course, that it did put her back into her usual state of health, and then she left hospice care.

Now let’s think about this. The usual course would have been an ambulance to the hospital, an emergency room visit, and a hospitalization, perhaps followed by a few days of skilled nursing facility care “to get her back on her feet.” And that course assumes no serious complications like a fall or an infection. Hospice cost about 1/10 as much. But why did her doctor and I have to figure out an end run around the rules that seemed to connive to ensure that she would have to go to the hospital, if not to get the antibiotic, then to get the fluids?

This time, the priorities were set by service providers seeking their convenience and perhaps their incomes, not by 93-year-old women very much wanting to live out their lives at home.

Most of us will be relatively healthy for most of our lives. We will end up spending about half our lifetime health care costs in the last years of life, when we are frail; needing food delivered by a friendly volunteer; needing that antibiotic to be available without going to the hospital; and needing some IV fluids at home today, not after a lot of paperwork gets done. We’ll need that remarkable primary care doctor who visits at home. But I sure hope that not everyone needs a physician daughter who can find one more question to ask to evade the ruthlessness of a seriously dysfunctional system, and we must all insist that no elderly person will ever need to wait 6 months without being able to count on food—not now, not ever, not in the United States.

If you agree, talk with your Congressional representatives today about reauthorizing the Older Americans Act and call on them to actually increase the funding to account for the increasing numbers and the current shortfalls. Tell them to take Older Americans Act funding out of the pool that is at risk of sequestration. Join us in pushing for some leadership communities to focus on building a care system constructed around the hopes and fears of frail elderly people themselves. Join the campaign by writing to us at [email protected].

twitterrssyoutube
Feb 252015
 

By Joanne Lynn

In late January, Department of Health and Human Services Secretary Sylvia Matthews Burwell announced that Medicare would purchase most services on the basis of value rather than volume, aiming for 90% of fee-for-service payments by 2018 [http://www.hhs.gov/blog/2015/01/26/progress-towards-better-care-smarter-spending-healthier-people.html]. Of course, paying on the basis of value is much better than paying on the basis of volume. But a moment’s reflection shows that this strategy requires figuring out what people value. For a child with a broken arm or a middle-aged woman with a gall-bladder attack, desirable outcomes are obvious, widely agreed upon, and readily measured. But this is just not the case for frail elders.

Consider a new heart attack affecting a 94-year-old living with multiple chronic conditions, self-care disability, and a lifetime of experiences and relationships. Different 94-year-olds will value very different things when it comes to treatment characteristics and quality-of-life goals; for example, some will desperately want not to go to the hospital, even if doing so would likely extend their lives, and others will welcome hospitalization with intensive care and every opportunity to get back to the way things were.

Even well-established quality metrics that are important to elder care, including avoiding delirium or the degree to which the person’s symptoms are addressed, are not yet used by Medicare, and the program has done little to develop ways to identify excellent care for frail elders. Rates of certain calamities and medical errors are currently measured, but elderly persons and their families expect that more will be monitored than mere safety. When we are old and frail and facing death, we need the quality of our care to be measured by whether it offers an opportunity to attend to important relationships, live comfortably, and pursue what matters most to each of us. Generic measures that reflect what someone else values won’t suffice.

Consider first what Medicare has set up as measures for this population. A starkly disturbing insight arises in the list of measures under consideration for implementing the Improving Medicare Post‐Acute Care Transformation (IMPACT) Act that are meant to measure outcomes and quality in after-hospital care. [List of Ad Hoc Measures under Consideration for the Improving Medicare Post‐Acute Care Transformation (IMPACT) Act of 2014, http://www.qualityforum.org/WorkArea/linkit.aspx?LinkIdentifier=id&ItemID=78784.] Given the short timeline, the Centers for Medicare and Medicaid Services (CMS) has proposed measures that have already been approved or that are in the process of approval. CMS proposes four measures, each applied in four care settings: the rate of pressure ulcers, the rate of falls with injury, the existence of functional assessment and whether there is a care plan with a goal that involves function, and readmissions.

But in setting out to talk with frail, elderly people leaving the hospital for a short-term stay in a nursing home before they go home, what do we imagine are their highest priorities? The four that Medicare proposes might make the list, except that the way we measure readmissions is seriously deficient, even with risk adjustment [ https://medicaring.org/2014/12/16/protecting-hospitals/; https://medicaring.org/2014/12/08/lynn-evidence/ ]. But most people have other priorities that are equally or more important, such as whether there is a workable plan to get the daily care and support needed (e.g., housing modifications, food, transportation, and personal care). Another question elders often ask is what the effects of their disabilities on the family will be, especially if family members have to provide more care. Elders may also want to be sure that they will have the symptom (pain) control, spiritual support, and reliable supportive care that they will need as their conditions get worse, whether they are in a care system that will maximally preserve their financial assets so that they have a lower risk of running out, and whether they will have to move to a nursing home. Medicare’s metrics don’t yet even try to address these concerns.

Even more troubling is the fact that Medicare does not yet have any methods to judge the match between the services given and the patient’s perspective as to what matters. Current metrics are all grounded in professional standards, and professionals have been slow to build standards that truly take into account the very different things that individuals want in late life. A high-quality service delivery system must try to match the priority needs and preferences of each elder.

As Medicare moves toward paying its providers on the basis of value, it is important to keep in mind what you value is often not what I value, and this difference becomes more pronounced as we have to live with physical and financial limitations and the increasing proximity of death. Here are some steps that we can take:

  • We should demand that Medicare invest in developing measures that matter for the frail phase of life before distorting the delivery system with incentives applying to everyone (e.g., to avoid pressure ulcers, falls, and readmissions) and to have and achieve goals concerning function.
  • CMS should be willing to be the “measures steward” or should fund another entity to do so, since the money available for frail elder care does not spin off strong organizations that can do the developmental work and then maintain updated measures.
  • Our health information systems (e.g., in Meaningful Use Stage 3) should at least start making room in medical records to document each patient’s priorities and the care plan that is supposed to reflect those priorities.

Buying on value is the right idea, but buying value for each elder requires knowing what each one values.

twitterrssyoutube
Dec 162014
 

by Stephen F. Jencks, M.D., M.P.H.

[Also see companion post by Joanne Lynn, M.D.]

Issue.

The Medicare Readmission Reduction Program (MRRP) encourages hospitals to reduce readmissions within 30 days of discharge by imposing substantial financial penalties on hospitals with more readmissions than would be expected if the same patients were discharged from an average hospital.[1] But some hospitals and communities have succeeded too well and reduced discharges even more than readmissions so that their readmission rates, as currently calculated, do not improve much, which puts them at higher risk for penalties. There are two underlying problems:

First, there are two ways of thinking about, and therefore measuring, the rate of readmissions; and they often lead to quite different results and quite different decisions on penalties. One is discharge-based; the other, population-based. The relationship between the two is simple: (readmissions/discharges) X (discharges/(beneficiary population (1,000s) ) ) = readmissions / (beneficiary population (1,000s))

Patients who are admitted but die during hospitalization or are transferred to another hospital are not counted as discharges from the first hospital.

Second, effective interventions to reduce 30-day readmissions have an effect on admissions that extends far beyond 30-days after discharge and they reduce a lot of other admissions, especially if implemented in partnership with community providers and services.

When Congress created the MRRP, many stakeholders had become aware (and dismayed) that 20% of people enrolled in Medicare fee-for-service and discharged from a hospital were readmitted within 30 days of hospital discharge. Clinical trials had shown that improved processes around hospital discharges could prevent many of these readmissions. The aim of establishing accountability also made a hospital focus desirable. In this view, readmission is a burden resulting from poor hospital discharge processes, whether clinically premature or poorly executed. With that emphasis on discharge processes as cause and cure for readmissions, it was natural for the Centers for Medicare & Medicaid Services (CMS) to choose to estimate each hospital’s expected readmissions as the number of patients whom the hospital discharged and who would be expected to be readmitted after discharge from an average hospital. Most readmission reduction initiatives use this discharge-based readmission rate to measure performance. This discharge-based perspective effectively defines the readmission rate as the percentage of discharges that are followed by a readmission. In this way of thinking, the number of hospital discharges is simply a fact of life, much like the fact that a year has 365.24 days. This view does not see that hospital actions might reduce the number of patients they discharge, and this blind spot causes trouble.

Hospitals actually have a great deal of influence on how many patients they admit and discharge because so many of their discharges are admitted through their emergency department or by hospital-affiliated physicians and because they can collaborate with community services and providers who can forestall patients even coming to the hospital. Population-based hospital discharge rates vary substantially across regions, and they can change over time.

Some policy makers worried that the discharge-based rate could behave in unexpected ways if hospitals took steps that reduced total discharges by more than the reduction in 30-day readmissions. As a result, several programs, such as the Partnership for Patients and the Quality Improvement Organizations’ (QIOs) Care Transitions Program, were designed using a population-based readmission rate or converted to such a rate after evaluating early findings. The population-based rate is the number of readmissions for every 1,000 fee-for-service Medicare beneficiaries in the hospital’s service area. This view sees readmissions as a community health problem, a burden on a population of beneficiaries and the Medicare trust funds that is associated with that population’s use of hospitals just as hospital-acquired infections are associated with use of hospitals. From this perspective, preventing hospitalizations, improving discharge transitions, and improving post-discharge care are equally valid ways to reduce readmissions. Whether the hospital reduced hospitalizations in order to reduce readmissions is less important than being sure that we do not penalize hospitals for taking such steps. Population-based rates are closely aligned with the three-part aim of the National Quality Strategy (individual care, population health, and affordability), not only because they are population-based but also because they reflect the close relationship between care in the community and a hospital’s apparent performance.

Thus, a program can reduce burdens on beneficiaries and Medicare through significant reductions in the population-based discharge and readmission rates but see much smaller reductions in the discharge-based readmission rate. In a companion blog to this piece, Joanne Lynn presents evidence that this attenuation of changes in discharge-based rates has happened repeatedly in community-based readmissions programs. We do not know, at this point, whether attenuation of changes translate into financial penalties but it seems very likely to increase a hospital’s risk.

We also do yet fully understand what specific changes produce these decreases in the population-based discharge rate, but the most parsimonious explanation is that the causes are pretty much the causes of reduced readmissions: Provide urgent care with support for keeping the patient in the community, and you are likely to reduce all admissions, not just readmissions. Enroll more patients in medical homes, and the benefits will not disappear 30 days after hospital discharge. Improve nursing home communications with emergency rooms, and the benefits will not be limited to patients within 30 days after hospital discharge.

What we can foresee is that hospitals, already wary of readmissions reduction because it directly reduces revenue, will become doubly wary if they conclude that reducing discharges may also cause or increase the MRRP penalty. If CMS is penalizing hospitals and communities for succeeding at improving care and reducing costs, the reaction may threaten a very successful set of initiatives. The examples we report are for community-based efforts to reduce readmissions. Hospital-level calculations are generally beyond our capability. CMS can, however, easily determine whether, all else being equal, penalties are more likely or larger in areas where the population-based hospital discharge rate is declining substantially than elsewhere. That information is urgently needed.

What to do.

The purpose of the MRRP is to reduce the burden of readmissions on Medicare beneficiaries and the Medicare trust funds, so the important indicator of progress is the number of readmissions, not the percentage of discharged patients that are readmitted.

Healthcare quality measurement needs to catch up with the National Quality Strategy and add measures of the impact of care on the health of the population that will complement measures of the quality of individual episodes of care such as hospitalizations. In the case of readmission measurement for the MRRP, this need is substantially more urgent because there is good reason to fear that a hospital that engages with its community and does exactly what the MRRP hopes for is more liable to financial penalties under the current, discharge-based measure than it would be under a population-based measure.

The first step is to assess the degree of urgency by examining national evidence on actual penalties. If unreasonable penalties are at all frequent then the problem is far more urgent. This will be complex, because Epstein has already shown in cross-sectional studies that population-based hospitalization rates and readmission rates are positively correlated.[2] At the same time it will be important to develop population-based measures of readmissions and compare their impact on penalties with the impact of discharge-based measures. The obstacles are bureaucratic, technical, and political.

Bureaucratically, the most important obstacle has been a widespread belief that the Patient Protection and Affordable Care Act requires calculating discharge-based rates. In fact, the Act says only that penalties are to be determined from the ratio of observed to expected numbers of readmissions and is silent on how the expected number is to be calculated. The other bureaucratic problem is less tractable: Under current procedures, the steps laid out for implementing a new measure, both at CMS and at the National Quality Forum (NQF) would likely take several years. The process should be expedited if the analysis of current penalties indicates that hospitals are being penalized for success in reducing admissions.

The technical challenges of creating a population-based readmission measure for hospitals are substantial. First, the procedure must find a way to measure each hospital’s population-based hospitalization rate. Second, a method of risk adjustment must be developed and applied so that population-based readmission rates for each hospital and community can be compared. Although these methods are still evolving, adjustments for factors such as neighborhood deprivation[3] are actually easier at the population level. These are difficult tasks, but a first step good enough to improve on the existing model should be possible within a year.

Politically, hospitals will be concerned about accountability for the community hospitalization rate. They will recognize that if hospitals in areas with low hospitalization rates are protected, then hospitals in areas with high hospitalization rates will be more vulnerable.

Some have hoped that traditional risk adjustment could solve this problem, because the most likely scenario is that average risk of readmission increases as the number of discharges decreases. That prospect is not promising, because the most assiduous work on risk adjustment has produced tools of only moderate power. The prospects for solving this problem with improved risk adjustment are not promising.[4],[5]

When you find yourself in a hole you should stop digging. It seems prudent for NQF to suspend endorsement of the pending discharge-based readmission measures and for CMS to delay implementing discharge-based measures if NQF endorses them until CMS has studied and reported the extent to which readmission penalties punish hospitals that are actually reducing both admissions and readmissions and has laid out an approach to any problems found. Finally, the problem identified here underlines the importance of placing a population-based foundation under at least some measures of health care system performance.

Footnotes:

[1] Centers for Medicare and Medicaid Services. Readmission reduction program. Retrieved from http://www.cms.gov/Medicare/Medicare-Fee-for-Service-Payment/AcuteInpatientPPS/Readmissions-Reduction-Program.html

[2] Epstein, A. M., Jha, A. K., & Orav, J. E. (2011 December 15). The relationship between hospital admission rates and rehospitalizations. New England Journal of Medicine 365(24).

[3] Kind, A. J. H., Jencks, S., Brock, J., Yu, M., Bartels, C., Ehlenbach, W., & Smith, M. (2014 December 2). Neighborhood socioeconomic disadvantage and 30-day rehospitalization: a retrospective cohort study. Annals of Internal Medicine 161(11) 765-775.

[4] Yale New Haven Health Services Corporation/Center for Outcomes Research & Evaluation. (2014, July). 2014 measure updates and specifications: Hospital-wide all-cause unplanned readmission – version 3.0. Retrieved from https://altarum.org/sites/default/files/uploaded-publication-files/Rdmsn_Msr_Updts_HWR_0714_0.pdf.

[5] Kansagara, D., Englander, H., Salanitro, A., Kagen, D., Theobald, C., Freeman, M., & Kripalani, S. (2011 October 19). Risk prediction models for hospital readmission: A systematic review. Journal of the American Medical Association 306(15) 1688-1698.

twitterrssyoutube
Dec 082014
 
Dr. Joanne Lynn Portrait

By Joanne Lynn M.D.

[Also see companion post by Stephen F. Jencks, M.D., M.P.H.]

Care transitions improvement programs have been effective in helping the health care system both become more effective in serving people living with serious chronic conditions and reduce costs. However, the key metric used to measure performance is seriously malfunctioning in at least some hospitals and communities, leading to penalties and adverse publicity for providers and communities that are actually performing well and continuing to improve performance. In this post we provide supporting data, and a companion blog article provides a thoughtful discussion of the conceptual issues underlying this troubling malfunction. For our earlier blog post about this problem see: https://medicaring.org/2014/08/26/malfunctioning-metrics/.

Very simply, this problem arises because the metric used is some variant of readmissions (within 30 days) divided by discharges (from a particular hospital) within a particular period. Thus, the usual metric is something like “20% of Medicare fee-for-service (FFS) hospitalizations are followed by a readmission within 30 days.” This metric works well if the denominator, namely the number of hospitalizations, is not affected by the improvements that reduce the risk of readmission. If the denominator declines along with the numerator, the metric will not reflect the degree of improvement that was actually achieved. The data below show that this happens in real situations.

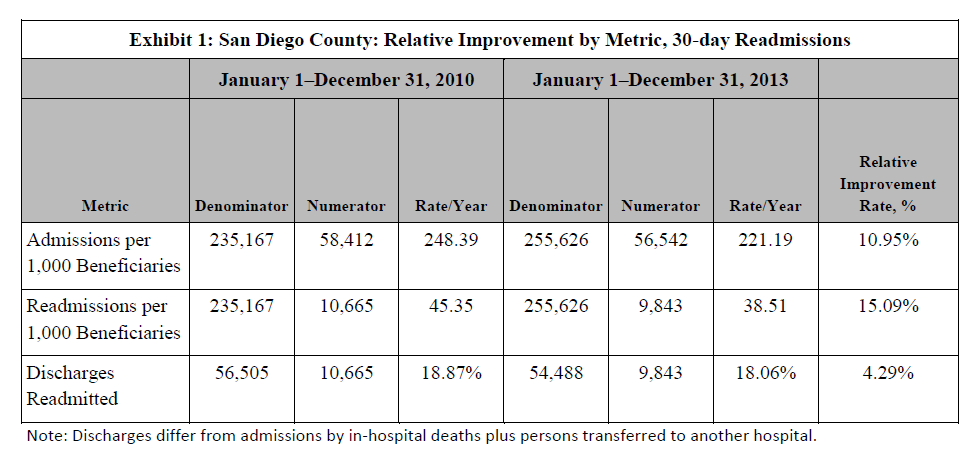
We are here showing the data from San Diego County, a very large county with about 250,000 Medicare FFS beneficiaries, who had about 60,000 Medicare FFS admissions to hospitals per year and about 10,000 readmissions per year in 2010, when almost all of the hospitals and the county’s Aging & Independence Services (functioning as the Community-based Care Transitions Program partner agency/Area Agency on Aging/Aging and Disability Resource Center) started working together to improve care transitions and reduce readmissions under the San Diego Care Transitions Program, one of the Community-based Care Transitions Programs initiated by Section 3026 of the Patient Protection and Affordable Care Act. The application year was 2012 and the start-up year was 2013. The table below shows an initial summary of their results, provided through their Quality Improvement Organization.

Exhibit 1: San Diego County: Relative Improvement by Metric, 30-day Readmissions

Exhibit 1: San Diego County: Relative Improvement by Metric, 30-day Readmissions

Readmissions of county Medicare FFS residents fell by 15% in 2013, compared with 2010. San Diego County reduced hospitalizations by 11%. However, when the numerator and denominator go down at nearly the same rate, the fraction moves just 4.3%, which falls far short of the 20% reduction goal that Medicare has set.

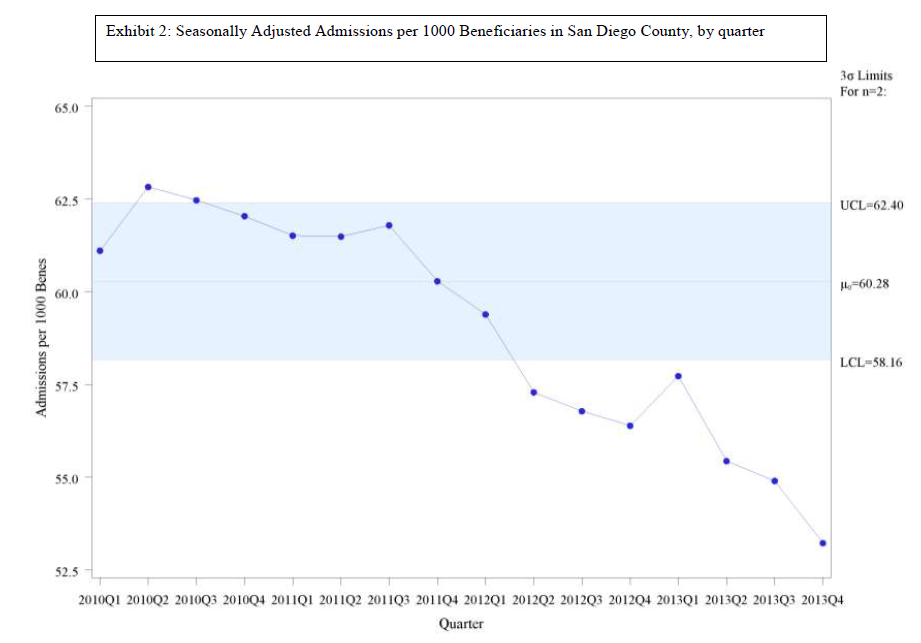
What follows are the quarterly data from San Diego. The first graph, Exhibit 2, shows the quarterly rate of admissions per 1,000 Medicare FFS beneficiaries in San Diego County. We have adjusted these data for the effects of seasons on admissions (since there are usually more admissions in the winter). The shaded portion shows the “control limits,” an area which represents the expected range of variation demonstrated in the first 3 years of the data (2010-2012). Data that fall outside of the range or that consistently run on one side of the midline indicate that something has changed in how the system is functioning. Clearly, admissions are falling.

San Diego Seasonally Adjusted Admissions

Exhibit 2: San Diego Seasonally Adjusted Admissions

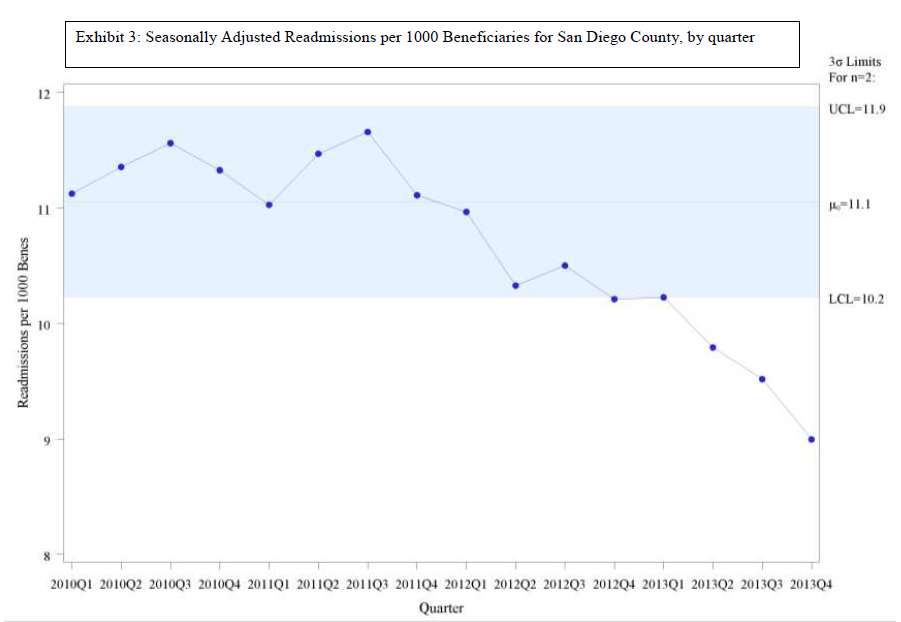
The second graph, Exhibit 3, shows the readmissions rate in the same framework – quarterly rate of readmissions per 1,000 Medicare FFS beneficiaries in San Diego County, adjusted for seasonality. The control limits again show change. Readmissions are falling.

Exhibit 3: Seasonally Adjusted Readmissions

Exhibit 3: Seasonally Adjusted Readmissions

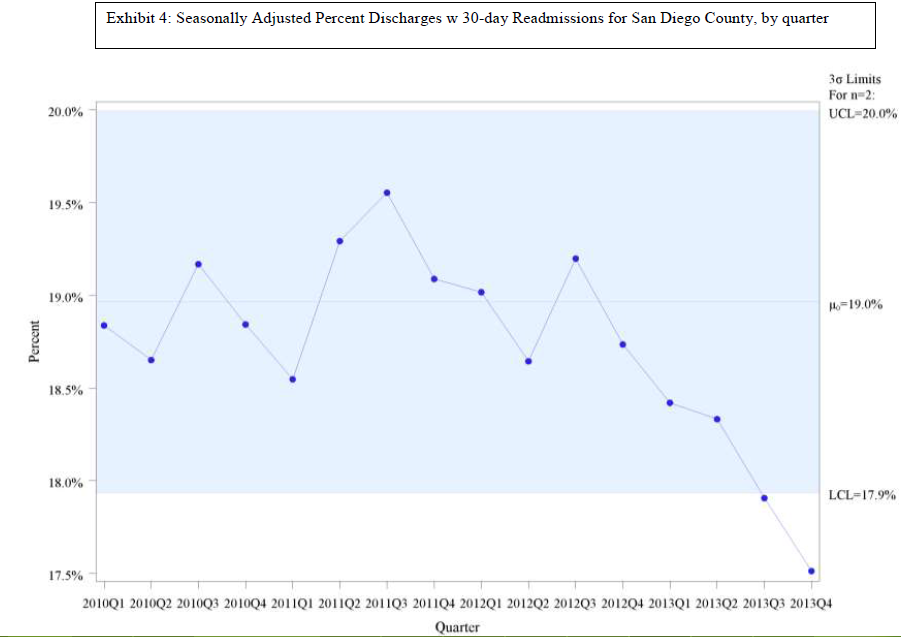
The third graph, Exhibit 4, shows the metric in the conventional form, readmissions divided by discharges. The graph does eventually show a decline, but only a modest one. The fact that the denominator was falling attenuated the impact of the falling number of readmissions.

Exhibit 4: Seasonally Adjusted Percent Discharges with 30-day Readmissions for San Diego County, by quarter

Exhibit 4: Seasonally Adjusted Percent Discharges with 30-day Readmissions for San Diego County, by quarter

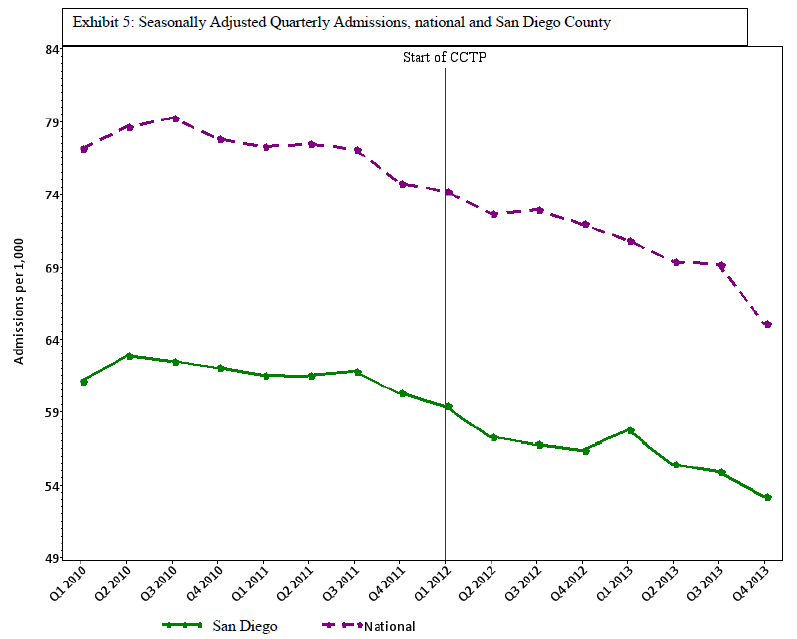
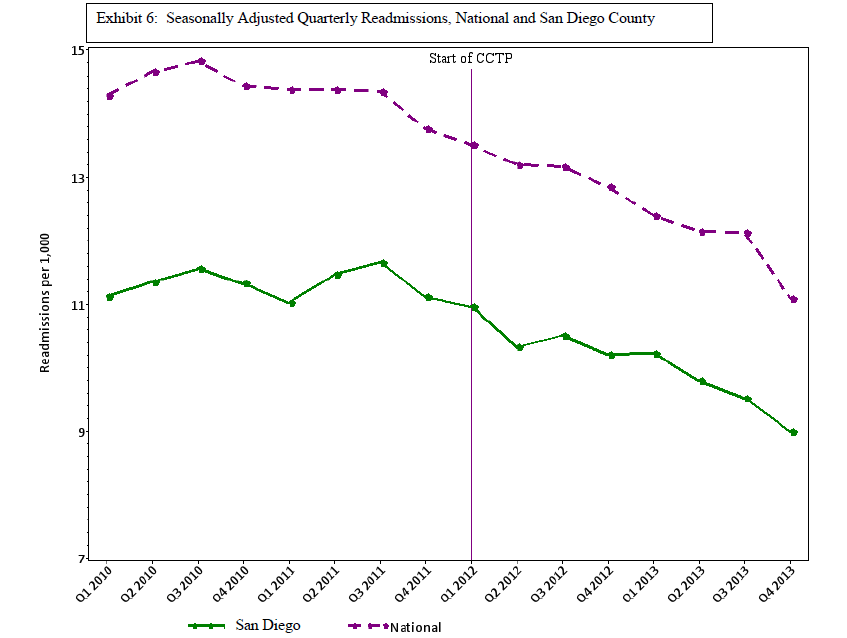
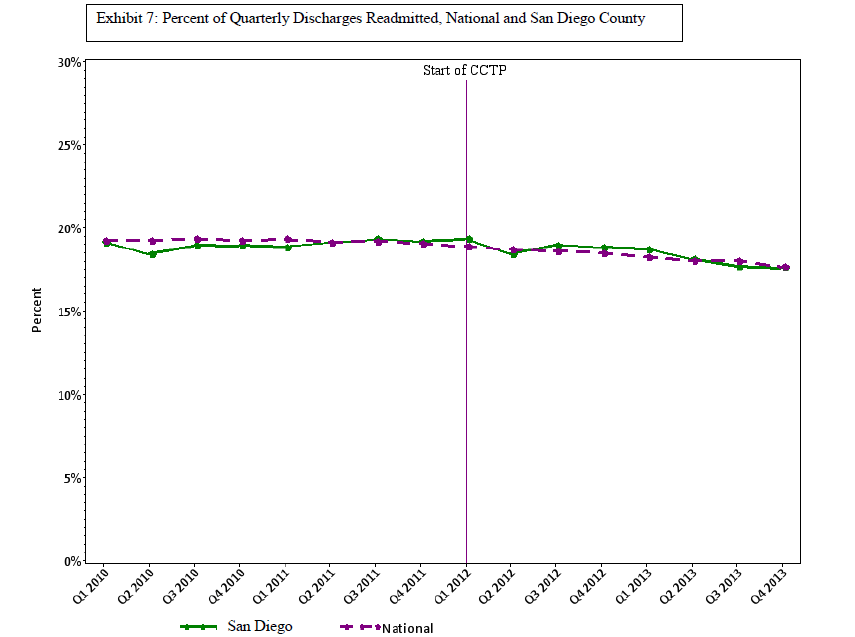
The next three exhibits show the comparison of the San Diego measures with the national rates for the same metrics. Exhibit 5 shows that San Diego County is dramatically less likely to have Medicare FFS beneficiaries in the hospital than the nation as a whole: 56 per 1,000 per quarter in San Diego, compared with 69 per 1,000 per quarter nationwide. Exhibit 6 shows that San Diego is also much lower in readmissions than the national average: 10 per 1,000 per quarter in San Diego, compared with 12 per 1,000 per quarter nationwide. In both cases, the declining use is reasonably parallel between San Diego and the nation. This would imply that improvement strategies are still being effective at this lower range, and thus the lower range is not yet a limit on improvement opportunities. Exhibit 7 shows that San Diego County’s conventional metric of readmissions divided by discharges simply tracks the national average. Clearly, the metric is not functioning in a way that reliably separates good practices from wasteful ones. That readmissions over discharges metric does not convey the fact that San Diego is much less likely to hospitalize and to rehospitalize. Indeed, 10 of the 14 San Diego hospitals eligible for penalties for high readmission rates are being penalized next year. Since the calculations that go into determining the hospital penalty focus on particular diagnoses in three past years, it is possible that these hospitals manage to do badly with those diagnoses in those years, but it seems quite unlikely. More plausibly, the metric used is of the readmission divided by discharge form, so the shrinking denominator will affect this calculation.

Exhibit 5: Seasonally Adjusted Quarterly Admissions, National and San Diego County

Exhibit 5: Seasonally Adjusted Quarterly Admissions, National and San Diego County

Exhibit 6: Seasonally Adjusted Quarterly Readmissions, National and San Diego County

Exhibit 6: Seasonally Adjusted Quarterly Readmissions, National and San Diego County

Exhibit 7: Percentage of Quarterly Discharges Readmitted, National and San Diego County

Exhibit 7: Percentage of Quarterly Discharges Readmitted, National and San Diego County

Without access to and analysis of much more data, one cannot know how widespread this problem is. We do know that San Francisco had an admission rate of just 50 per 1,000 per quarter in 2013 and a readmission rate of just 8 per 1,000 per quarter, which are rates much lower than San Diego. Yet 8 of San Francisco’s 10 eligible hospitals will be penalized for excessive readmissions in 2015. Furthermore, we know that the initial Medicare foray into this work, published in the Journal of the American Medical Association in January 2013 (link: http://jama.jamanetwork.com/article.aspx?articleid=1558278&resultClick=3 “Association Between Quality Improvement for Care Transitions in Communities and Rehospitalizations Among Medicare Beneficiaries”, see “Outcome Measures”), involved 14 smaller communities, and that project had to change from using the discharge-based metric to using the population-based metric when it became clear that the shrinking denominator was making the project monitoring unreliable.

Hospitals, other providers, and communities that believe they may be adversely affected by the malfunctioning metrics should have access to the data needed to investigate and CMS should welcome reconsideration of those situations. NQF should suspend endorsement of new readmission/discharge metrics and re-examing existing ones. CMS has multiple contractors working on readmissions, and some have substantial experience and skills in the technical details of these metrics. CMS should quickly modify their contracts to require them to investigate the extent of this problem, to identify steps to ameliorate adverse impacts of the current readmissions/discharges metrics, and to build the metrics that can guide care transitions work into the future. Certainly, the time has come to sort this out and develop metrics that reliably separate exemplary from persistently inefficient practices.

Want to know more?

“Protecting Hospitals that Improve Population Health” by Stephen F. Jencks.
https://medicaring.org/2014/12/16/protecting-hospitals/

“Senior Alert: A Swedish National Dashboard for Preventitive Care for the Elderly” by Elizabeth Rolf.
https://medicaring.org/2014/12/22/senior-alert/

twitterrssyoutube