2.3 How could the delivery system use care plans to improve the service supply and quality?
Once a community has care planning working for most frail elderly people in a population and has a way to aggregate defined elements electronically, then the community has the makings of a remarkable tool for managing the service supply and quality for that population. With multiple communities, the method would allow benchmarking supply against demand (since oversupply is often as problematic as undersupply), geo-mapping service demand and availability and testing for mis-matches, detecting perceptions of quality or delay problems, and more. If the care planning process includes making note of the compromises that inadequate supply or quality has required, then the aggregation can also tally those shortcomings as real-time evidence of problems. What follows is our first working out of a method to manage the service supply arrangements for a community, fueled by care plans.
This example is meant just to show the possibilities for community-based management. Having most frail elders’ care plans would allow development of a powerful method for monitoring and managing the supply and quality of services for the whole community’s frail elderly population. If the care plans also recorded the compromises caused by shortages or quality problems, that will create a method for weighing priorities among possible improvement activities.
In short, care planning is essential, though sometimes difficult, and many forces are converging to push care providers serving elderly persons living with chronic conditions to build elder-driven care plans.
Figure 2.2: Optimizing a Service Production System
How many frail elderly? Estimates here for a hypothetical community of 600,000 residents are roughly supported by research and experience. A useful model for a specific community would need the actual targeted population, including population metrics of the rates of frailty and disability and the expected case load for the workforce. The point here is to illustrate the powerful tool that a community could develop from aggregating the care plans of their frail elders.
- In a community of 600,000 residents, about 6,000 die each year, about 5,000 in old age.
- About 2,500 die of a single overwhelming disease (generally appropriate for hospice and needing little long-term care or complicated planning for supportive services).
- About 2,500 die of frailty, including multiple chronic conditions and advanced illness complicated by supportive service needs.
- Substantial self-care disability for frail elders will last an average of two years before death.
- Thus, at any one time, about 5,000 frail adults >65 years of age will be in need of supportive services in the last years of life.
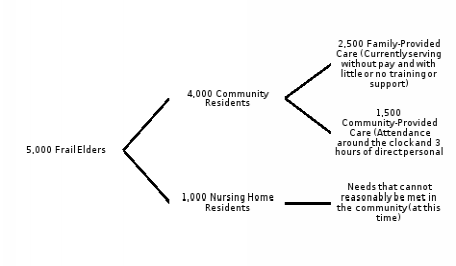
Table 2.1: Workforce Example: Estimating Primary Care Providers Doing Home Visits
Number of home visits
- 4,000 people living with serious frailty in the community
- Routine visit every 4 months
- Urgent visit 3/year
- 4,000 X 6 = 24,000 home visits needed
Primary Care Provider (PCP) Requirements
- Can see ~10 visits/day (with assistant/driver)
- ~240 days per year
- 10 X 240 = 2,400 visits / PCP /year
- The community needs 10 full-time PCPs (and 10 full-time assistants/drivers) to serve frail elders at home.
- They can also provide 24/7 coverage for urgent situations by cross-covering out-of-hours calls.
Table 2.2: Estimates for others in the workforce for the sample community
|
|
1,000 Nursing Home Elders |
4,000 Community Elders |
|
Direct Care Workers |
500 (at a 1:6 ratio, 3 shifts, all year) |
800 (at about 3 hours/elder/weekday, plus travel and time off) |
|
Nurses |
100 |
500 |
|
Therapists |
100 |
100 |
|
Primary Care Providers (PCPs) |
5 |
10 |
|
Drivers and Scribes |
0 |
10 |
|
Hospital Beds |
50 |
250 |
